Capture de paquets
Texte en anglais
1. Introduction
Capturing live network data is one of the major features of Wireshark.
The Wireshark capture engine provides the following features:
- Capture from different kinds of network hardware such as Ethernet or 802.11.
- Stop the capture on different triggers such as the amount of captured data, elapsed time, or the number of packets.
- Simultaneously show decoded packets while Wireshark is capturing.
- Filter packets, reducing the amount of data to be captured. See Section 4.13, “Filtering while capturing”.
- Save packets in multiple files while doing a long term capture, optionally rotating through a fixed number of files (a “ringbuffer”). See Section 4.11, “Capture files and file modes”.
- Simultaneously capture from multiple network interfaces.
The capture engine still lacks the following features:
- Stop capturing (or perform some other action) depending on the captured data.
2. Prerequisites
Setting up Wireshark to capture packets for the first time can be tricky. A comprehensive guide “How To setup a Capture” is available at https://wiki.wireshark.org/CaptureSetup.
Here are some common pitfalls:
- You may need special privileges to start a live capture.
- You need to choose the right network interface to capture packet data from.
- You need to capture at the right place in the network to see the traffic you want to see.
If you have any problems setting up your capture environment you should have a look at the guide mentioned above.
3. Start Capturing
The following methods can be used to start capturing packets with Wireshark:
- You can double-click on an interface in the main window.
- You can get an overview of the available interfaces using the “Capture Interfaces” dialog box (Capture → Options…). See Figure 4.1, “The “Capture Interfaces” dialog box on Microsoft Windows” or Figure 4.2, “The “Capture Interfaces” dialog box on Unix/Linux” for more information. You can start a capture from this dialog box using the Start button.
- You can immediately start a capture using your current settings by selecting Capture → Start or by cliking the first toolbar button.
- If you already know the name of the capture interface you can start Wireshark from the command line:
$ wireshark -i eth0 -k
This will start Wireshark capturing on interface eth0. More details can be found at Section 10.2, “Start Wireshark from the command line”.
4. The “Capture Interfaces” dialog box
When you select Capture → Options… from the main menu Wireshark pops up the “Capture Interfaces” dialog box as shown in Figure 4.1, “The “Capture Interfaces” dialog box on Microsoft Windows” or Figure 4.2, “The “Capture Interfaces” dialog box on Unix/Linux”.
Both you and your OS can hide interfaces
This dialog box will only show the local interfaces Wireshark can access. It will also hide interfaces marked as hidden in Section 10.5.1, “Interface Options”. As Wireshark might not be able to detect all local interfaces and it cannot detect the remote interfaces available there could be more capture interfaces available than listed.
It is possible to select more than one interface and capture from them simultaneously.
Figure 4.1. The “Capture Interfaces” dialog box on Microsoft Windows
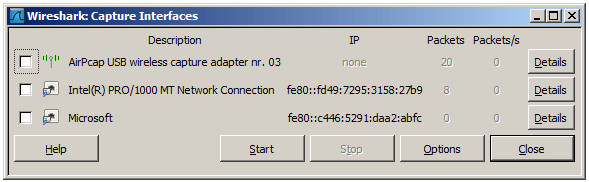
Figure 4.2. The “Capture Interfaces” dialog box on Unix/Linux
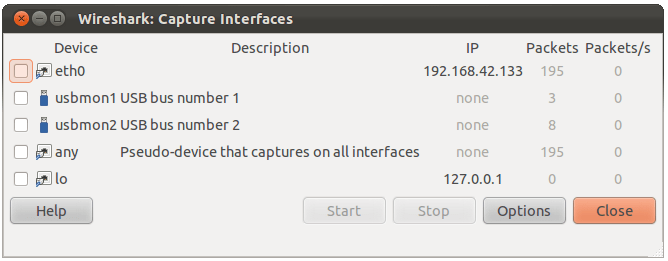
Device (Unix/Linux only) The interface device name.
Description The interface description provided by the operating system, or the user defined comment added in Section 10.5.1, “Interface Options”.
IP The first IP address Wireshark could find for this interface. You can click on the address to cycle through other addresses assigned to it, if available. If no address could be found “none” will be displayed.
Packets The number of packets captured from this interface, since this dialog was opened. Will be greyed out, if no packet was captured in the last second.
Packets/s Number of packets captured in the last second. Will be greyed out, if no packet was captured in the last second.
Stop Stop a currently running capture.
Start Start a capture on all selected interfaces immediately, using the settings from the last capture or the default settings, if no options have been set.
Options Open the Capture Options dialog with the marked interfaces selected. See Section 4.5, “The “Capture Options” dialog box”.
Details (Microsoft Windows only) Open a dialog with detailed information about the interface. See Section 4.10, “The “Interface Details” dialog box”.
Help Show this help page.
Close Close this dialog box.
5. The “Capture Options” dialog box
When you select Capture → Options… (or use the corresponding item in the main toolbar), Wireshark pops up the “Capture Options” dialog box as shown in Figure 4.3, “The “Capture Options” dialog box”.
Figure 4.3. The “Capture Options” dialog box

If you are unsure which options to choose in this dialog box just try keeping the defaults as this should work well in many cases.
Capture frame
The table shows the settings for all available interfaces:
- The name of the interface and its IP addresses. If no address could be resolved from the system, “none” will be shown.
Loopback interfaces are not available on Windows platforms.
- The link-layer header type.
- The information whether promicuous mode is enabled or disabled.
- The maximum amount of data that will be captured for each packet. The default value is set to the 65535 bytes.
- The size of the kernel buffer that is reserved to keep the captured packets.
- The information whether packets will be captured in monitor mode (Unix/Linux only).
- The chosen capture filter.
By marking the checkboxes in the first column the interfaces are selected to be captured from. By double-clicking on an interface the “Edit Interface Settings” dialog box as shown in Figure 4.4, “The “Edit Interface Settings” dialog box” will be opened.
Capture on all interfaces As Wireshark can capture on multiple interfaces it is possible to choose to capture on all available interfaces.
Capture all packets in promiscuous mode This checkbox allows you to specify that Wireshark should put all interfaces in promiscuous mode when capturing.
Capture Filter This field allows you to specify a capture filter for all interfaces that are currently selected. Once a filter has been entered in this field, the newly selected interfaces will inherit the filter. Capture filters are discussed in more details in Section 4.13, “Filtering while capturing”. It defaults to empty, or no filter.
You can also click on the Capture Filter button and Wireshark will bring up the Capture Filters dialog box and allow you to create and/or select a filter. Please see Section 6.6, “Defining and saving filters”
Compile selected BPFs This button allows you to compile the capture filter into BPF code and pop up a window showing you the resulting pseudo code. This can help in understanding the working of the capture filter you created. The Compile Selected BPFs button leads you to Figure 4.5, “The “Compile Results” dialog box”.
Linux power user tip
The execution of BPFs can be sped up on Linux by turning on BPF JIT by executing
$ echo 1 >/proc/sys/net/core/bpf_jit_enable
if it is not enabled already. To make the change persistent you can use sysfsutils.
Manage Interfaces The Manage Interfaces button opens the Figure 4.6, “The “Add New Interfaces” dialog box” where pipes can be defined, local interfaces scanned or hidden, or remote interfaces added (Windows only).
Capture File(s) frame
An explanation about capture file usage can be found in Section 4.11, “Capture files and file modes”.
File This field allows you to specify the file name that will be used for the capture file. This field is left blank by default. If the field is left blank, the capture data will be stored in a temporary file. See Section 4.11, “Capture files and file modes” for details.
You can also click on the button to the right of this field to browse through the filesystem.
Use multiple files Instead of using a single file Wireshark will automatically switch to a new one if a specific trigger condition is reached.
Use pcap-ng format This checkbox allows you to specify that Wireshark saves the captured packets in pcap-ng format. This next generation capture file format is currently in development. If more than one interface is chosen for capturing, this checkbox is set by default. See https://wiki.wireshark.org/Development/PcapNg for more details on pcap-ng.
Next file every n megabyte(s) Multiple files only. Switch to the next file after the given number of byte(s)/kilobyte(s)/megabyte(s)/gigabyte(s) have been captured.
Next file every n minute(s) Multiple files only: Switch to the next file after the given number of second(s)/minutes(s)/hours(s)/days(s) have elapsed.
Ring buffer with n files Multiple files only: Form a ring buffer of the capture files with the given number of files.
Stop capture after n file(s) Multiple files only: Stop capturing after switching to the next file the given number of times.
Stop Capture… frame
… after n packet(s) Stop capturing after the given number of packets have been captured.
… after n megabytes(s) Stop capturing after the given number of byte(s)/kilobyte(s)/megabyte(s)/gigabyte(s) have been captured. This option is greyed out if “Use multiple files” is selected.
… after n minute(s) Stop capturing after the given number of second(s)/minutes(s)/hours(s)/days(s) have elapsed.
Display Options frame
Update list of packets in real time This option allows you to specify that Wireshark should update the packet list pane in real time. If you do not specify this, Wireshark does not display any packets until you stop the capture. When you check this, Wireshark captures in a separate process and feeds the captures to the display process.
Automatic scrolling in live capture This option allows you to specify that Wireshark should scroll the packet list pane as new packets come in, so you are always looking at the last packet. If you do not specify this Wireshark simply adds new packets onto the end of the list but does not scroll the packet list pane. This option is greyed out if “Update list of packets in real time” is disabled.
Name Resolution frame
Enable MAC name resolution This option allows you to control whether or not Wireshark translates MAC addresses into names. See Section 7.8, “Name Resolution”.
Enable network name resolution This option allows you to control whether or not Wireshark translates network addresses into names. See Section 7.8, “Name Resolution”.
Enable transport name resolution This option allows you to control whether or not Wireshark translates transport addresses into protocols. See Section 7.8, “Name Resolution”.
Buttons
Once you have set the values you desire and have selected the options you need, simply click on Start to commence the capture or Cancel to cancel the capture.
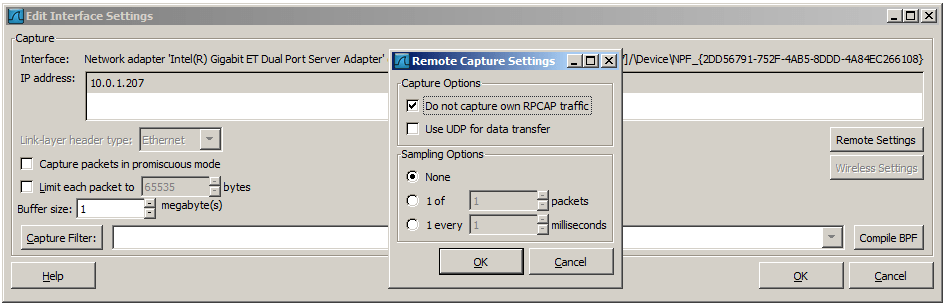
6. The “Edit Interface Settings” dialog box
If you double-click on an interface in Figure 4.3, “The “Capture Options” dialog box” the following dialog box pops up.
Figure 4.4. The “Edit Interface Settings” dialog box
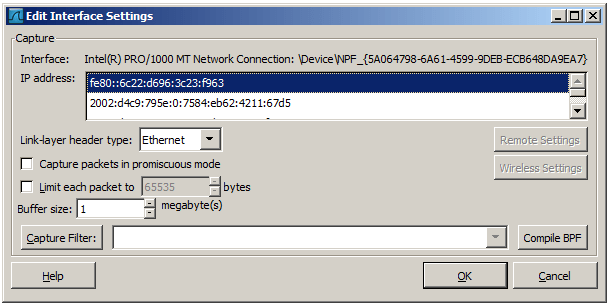
You can set the following fields in this dialog box:
IP address The IP address(es) of the selected interface. If no address could be resolved from the system “none” will be shown.
Link-layer header type Unless you are in the rare situation that requires this keep the default setting. For a detailed description. See Section 4.12, “Link-layer header type”
Wireless settings (Windows only) Here you can set the settings for wireless capture using the AirPCap adapter. For a detailed description see the AirPCap Users Guide.
Remote settings (Windows only) Here you can set the settings for remote capture. For a detailed description see Section 4.9, “The “Remote Capture Interfaces” dialog box”
Capture packets in promiscuous mode This checkbox allows you to specify that Wireshark should put the interface in promiscuous mode when capturing. If you do not specify this Wireshark will only capture the packets going to or from your computer (not all packets on your LAN segment).
If some other process has put the interface in promiscuous mode you may be capturing in promiscuous mode even if you turn off this option.
Even in promiscuous mode you still won’t necessarily see all packets on your LAN segment. See the Wireshark FAQ for more information.
Limit each packet to n bytes This field allows you to specify the maximum amount of data that will be captured for each packet, and is sometimes referred to as the snaplen. If disabled the value is set to the maximum 65535 which will be sufficient for most protocols. Some rules of thumb:
- If you are unsure just keep the default value.
- If you don’t need or don’t want all of the data in a packet - for example, if you only need the link-layer, IP, and TCP headers - you might want to choose a small snapshot length, as less CPU time is required for copying packets, less buffer space is required for packets, and thus perhaps fewer packets will be dropped if traffic is very heavy.
- If you don’t capture all of the data in a packet you might find that the packet data you want is in the part that’s dropped or that reassembly isn’t possible as the data required for reassembly is missing.
Buffer size: n megabyte(s) Enter the buffer size to be used while capturing. This is the size of the kernel buffer which will keep the captured packets, until they are written to disk. If you encounter packet drops, try increasing this value.
Capture packets in monitor mode (Unix/Linux only) This checkbox allows you to setup the Wireless interface to capture all traffic it can receive, not just the traffic on the BSS to which it is associated, which can happen even when you set promiscuous mode. Also it might be necessary to turn this option on in order to see IEEE 802.11 headers and/or radio information from the captured frames.
In monitor mode the adapter might disassociate itself from the network it was associated to.
Capture Filter This field allows you to specify a capture filter. Capture filters are discussed in more details in Section 4.13, “Filtering while capturing”. It defaults to empty, or no filter.
You can also click on the Capture Filter button and Wireshark will bring up the “Capture Filters” dialog box and allow you to create and/or select a filter. Please see Section 6.6, “Defining and saving filters”
Compile BPF This button allows you to compile the capture filter into BPF code and pop up a window showing you the resulting pseudo code. This can help in understanding the working of the capture filter you created.
7. The “Compile Results” dialog box
This figure shows the compile results of the selected interfaces.
Figure 4.5. The “Compile Results” dialog box
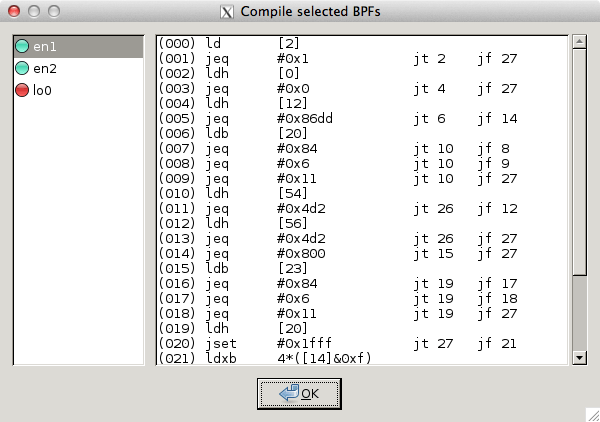
In the left window the interface names are listed. The results of an individual interface are shown in the right window when it is selected.
8. The “Add New Interfaces” dialog box
As a central point to manage interfaces this dialog box consists of three tabs to add or remove interfaces.
Figure 4.6. The “Add New Interfaces” dialog box
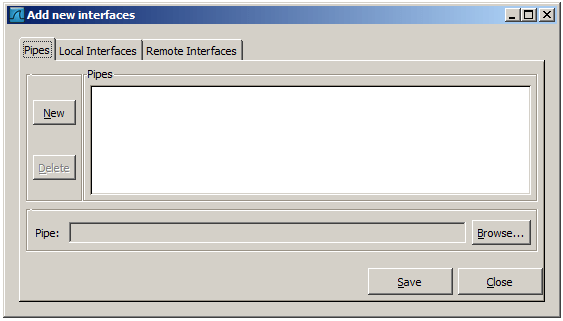
Add or remove pipes
Figure 4.7. The “Add New Interfaces - Pipes” dialog box
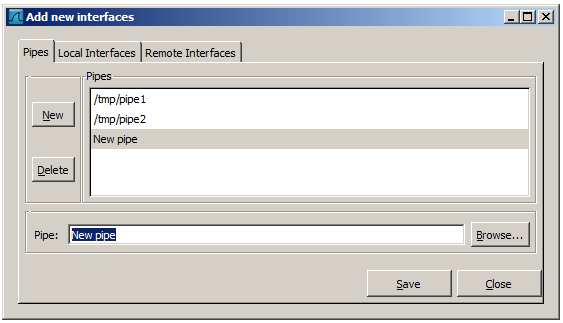
To successfully add a pipe, this pipe must have already been created. Click the New button and type the name of the pipe including its path. Alternatively, the Browse button can be used to locate the pipe. With the Save button the pipe is added to the list of available interfaces. Afterwards, other pipes can be added.
To remove a pipe from the list of interfaces it first has to be selected. Then click the Delete button.
Add or hide local interfaces
Figure 4.8. The “Add New Interfaces - Local Interfaces” dialog box
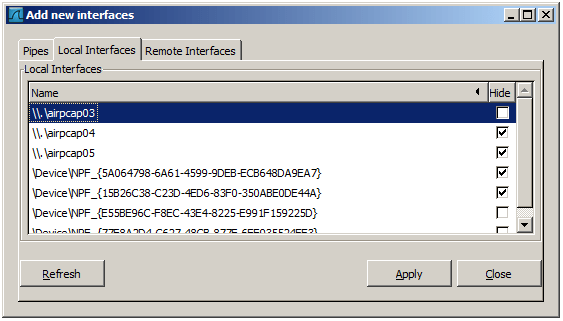
The tab “Local Interfaces” contains a list of available local interfaces, including the hidden ones, which are not shown in the other lists.
If a new local interface is added, for example, a wireless interface has been activated, it is not automatically added to the list to prevent the constant scanning for a change in the list of available interfaces. To renew the list a rescan can be done.
One way to hide an interface is to change the preferences. If the “Hide” checkbox is activated and the Apply button clicked, the interface will not be seen in the lists of the “Capture Interfaces” dialog box any more. The changes are also saved in the preferences file.
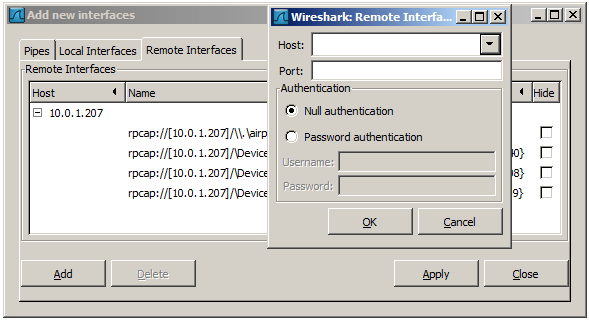
Add or hide remote interfaces
Figure 4.9. The “Add New Interfaces - Remote Interfaces” dialog box
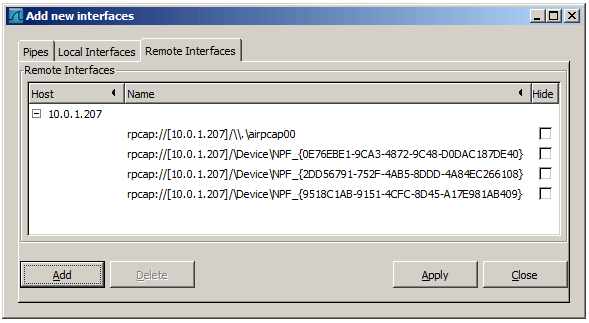
In this tab interfaces on remote hosts can be added. One or more of these interfaces can be hidden. In contrast to the local interfaces they are not saved in the preferences file.
To remove a host including all its interfaces from the list, it has to be selected. Then click the Delete button.
For a detailed description see Section 4.9, “The “Remote Capture Interfaces” dialog box”
9. The “Remote Capture Interfaces” dialog box
Besides doing capture on local interfaces Wireshark is capable of reaching out across the network to a so called capture daemon or service processes to receive captured data from.
Microsoft Windows only
This dialog and capability is only available on Microsoft Windows. On Linux/Unix you can achieve the same effect (securely) through an SSH tunnel.
The Remote Packet Capture Protocol service must first be running on the target platform before Wireshark can connect to it. The easiest way is to install WinPcap from https://www.winpcap.org/install/ on the target. Once installation is completed go to the Services control panel, find the Remote Packet Capture Protocol service and start it.
Make sure you have outside access to port 2002 on the target platform. This is the port where the Remote Packet Capture Protocol service can be reached by default.
To access the Remote Capture Interfaces dialog use the “Add New Interfaces - Remote” dialog. See Figure 4.9, “The “Add New Interfaces - Remote Interfaces” dialog box” and select Add.
Remote Capture Interfaces
Figure 4.10. The “Remote Capture Interfaces” dialog box
You have to set the following parameters in this dialog:
Host Enter the IP address or host name of the target platform where the Remote Packet Capture Protocol service is listening. The drop down list contains the hosts that have previously been successfully contacted. The list can be emptied by choosing “Clear list” from the drop down list.
Port Set the port number where the Remote Packet Capture Protocol service is listening on. Leave open to use the default port (2002).
Null authentication Select this if you don’t need authentication to take place for a remote capture to be started. This depends on the target platform. Configuring the target platform like this makes it insecure.
Password authentication This is the normal way of connecting to a target platform. Set the credentials needed to connect to the Remote Packet Capture Protocol service.
Remote Capture Settings
The remote capture can be further fine tuned to match your situation. The Remote Settings button in Figure 4.4, “The “Edit Interface Settings” dialog box” gives you this option. It pops up the dialog shown in Figure 4.11, “The “Remote Capture Settings” dialog box”.
Figure 4.11. The “Remote Capture Settings” dialog box
You can set the following parameters in this dialog:
Do not capture own RPCAP traffic This option sets a capture filter so that the traffic flowing back from the Remote Packet Capture Protocol service to Wireshark isn’t captured as well and also send back. The recursion in this saturates the link with duplicate traffic.
You only should switch this off when capturing on an interface other than the interface connecting back to Wireshark.
Use UDP for data transfer Remote capture control and data flows over a TCP connection. This option allows you to choose an UDP stream for data transfer.
Sampling option None This option instructs the Remote Packet Capture Protocol service to send back all captured packets which have passed the capture filter. This is usually not a problem on a remote capture session with sufficient bandwidth.
Sampling option 1 of x packets This option limits the Remote Packet Capture Protocol service to send only a sub sampling of the captured data, in terms of number of packets. This allows capture over a narrow band remote capture session of a higher bandwidth interface.
Sampling option 1 every x milliseconds This option limits the Remote Packet Capture Protocol service to send only a sub sampling of the captured data in terms of time. This allows capture over a narrow band capture session of a higher bandwidth interface.
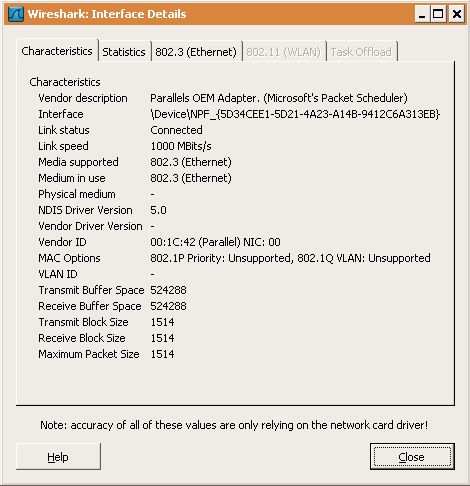
10. The “Interface Details” dialog box
When you select Details from the Capture Interface menu, Wireshark pops up the “Interface Details” dialog box as shown in Figure 4.12, “The “Interface Details” dialog box”. This dialog shows various characteristics and statistics for the selected interface.
Microsoft Windows only
This dialog is only available on Microsoft Windows
Figure 4.12. The “Interface Details” dialog box
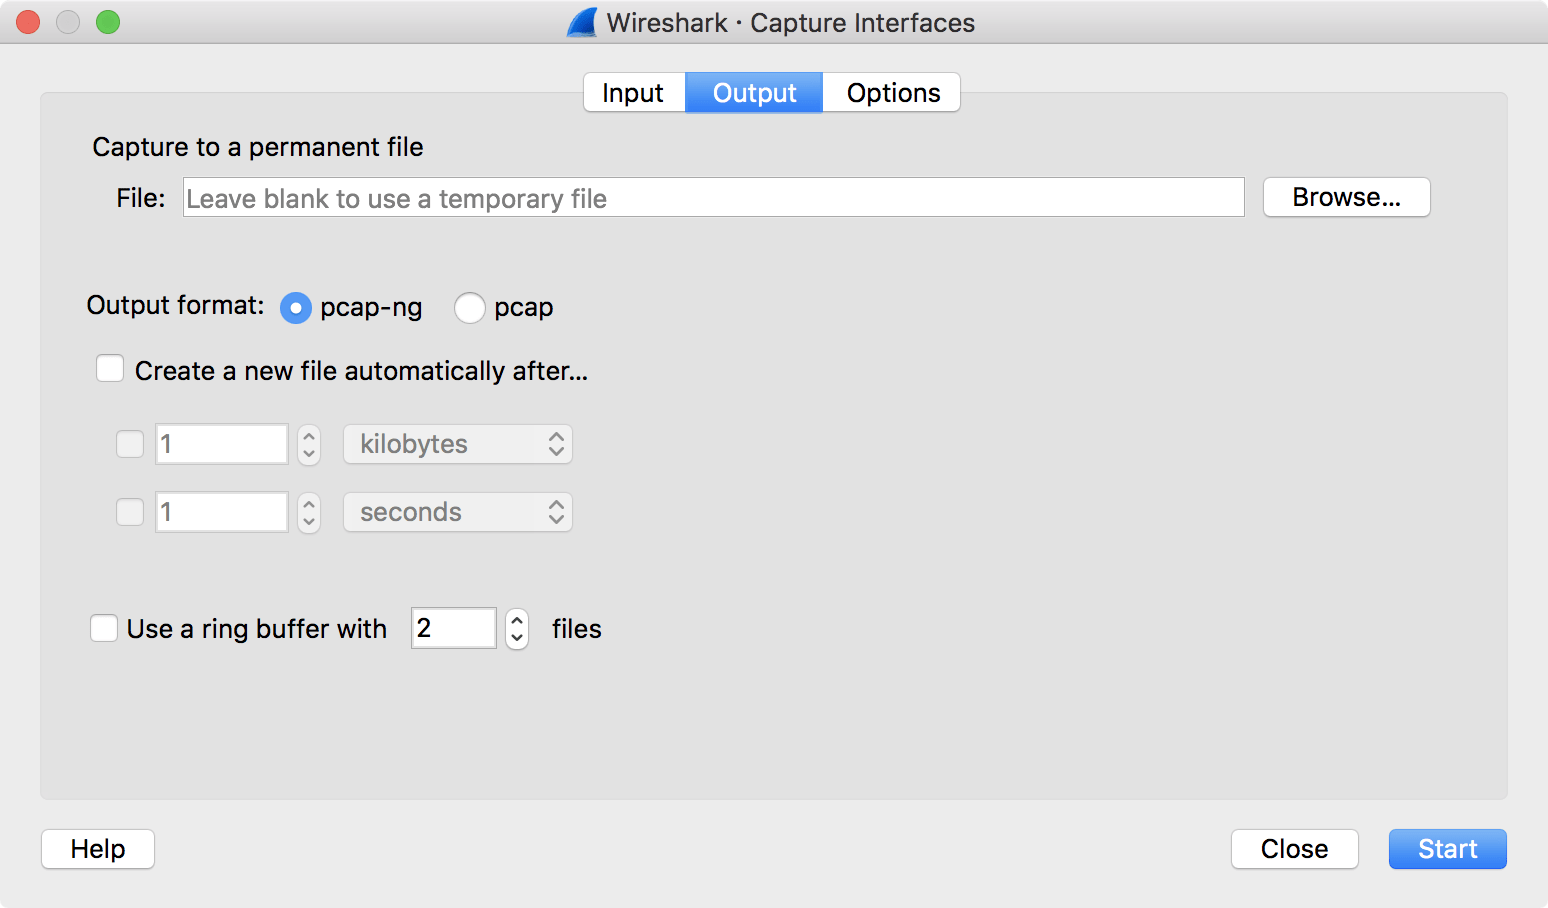
11. Capture files and file modes
While capturing the underlying libpcap capturing engine will grab the packets from the network card and keep the packet data in a (relatively) small kernel buffer. This data is read by Wireshark and saved into a capture file.
By default Wireshark saves packets to a temporary file. You can also tell Wireshark to save to a specific (“permanent”) file and switch to a different file after a given time has elapsed or a given number of packets have been captured. These options are controlled in the “Output” tab in the “Capture Options” dialog.
Figure 4.13. Capture output options
Working with large files (several hundred MB) can be quite slow. If you plan to do a long term capture or capturing from a high traffic network, think about using one of the “Multiple files” options. This will spread the captured packets over several smaller files which can be much more pleasant to work with.
Using Multiple files may cut context related information. Wireshark keeps context information of the loaded packet data, so it can report context related problems (like a stream error) and keeps information about context related protocols (e.g. where data is exchanged at the establishing phase and only referred to in later packets). As it keeps this information only for the loaded file, using one of the multiple file modes may cut these contexts. If the establishing phase is saved in one file and the things you would like to see is in another, you might not see some of the valuable context related information.
Information about the folders used for capture files can be found in Appendix B, Files and Folders.
Table 4.1. Capture file mode selected by capture options
| File Name | “Create a new file…” | “Use a ring buffer…” | Mode | Resulting filename(s) used |
|---|---|---|---|---|
| - | - | - | Single temporary file | wiresharkXXXXXX (where XXXXXX is a unique number) |
| foo.cap | - | - | Single named file | foo.cap |
| foo.cap | x | - | Multiple files, continuous | foo_00001_20100205110102.cap, foo_00002_20100205110318.cap, … |
| foo.cap | x | x | Multiple files, ring buffer | foo_00001_20100205110102.cap, foo_00002_20100205110318.cap, … |
Single temporary file A temporary file will be created and used (this is the default). After capturing is stopped this file can be saved later under a user specified name.
Single named file A single capture file will be used. If you want to place the new capture file in a specific folder choose this mode.
Multiple files, continuous Like the “Single named file” mode, but a new file is created and used after reaching one of the multiple file switch conditions (one of the “Next file every …” values).
Multiple files, ring buffer Much like “Multiple files continuous”, reaching one of the multiple files switch conditions (one of the “Next file every …” values) will switch to the next file. This will be a newly created file if value of “Ring buffer with n files” is not reached, otherwise it will replace the oldest of the formerly used files (thus forming a “ring”). This mode will limit the maximum disk usage, even for an unlimited amount of capture input data, only keeping the latest captured data.
12. Link-layer header type
In most cases you won’t have to modify link-layer header type. Some exceaptions are as follows:
If you are capturing on an Ethernet device you might be offered a choice of “Ethernet” or “DOCSIS”. If you are capturing traffic from a Cisco Cable Modem Termination System that is putting DOCSIS traffic onto the Ethernet to be captured, select “DOCSIS”, otherwise select “Ethernet”.
If you are capturing on an 802.11 device on some versions of BSD you might be offered a choice of “Ethernet” or “802.11”. “Ethernet” will cause the captured packets to have fake (“cooked”) Ethernet headers. “802.11” will cause them to have full IEEE 802.11 headers. Unless the capture needs to be read by an application that doesn’t support 802.11 headers you should select “802.11”.
If you are capturing on an Endace DAG card connected to a synchronous serial line you might be offered a choice of “PPP over serial” or “Cisco HDLC”. If the protocol on the serial line is PPP, select “PPP over serial” and if the protocol on the serial line is Cisco HDLC, select “Cisco HDLC”.
If you are capturing on an Endace DAG card connected to an ATM network you might be offered a choice of “RFC 1483 IP-over-ATM” or “Sun raw ATM”. If the only traffic being captured is RFC 1483 LLC-encapsulated IP, or if the capture needs to be read by an application that doesn’t support SunATM headers, select “RFC 1483 IP-over-ATM”, otherwise select “Sun raw ATM”.
13. Filtering while capturing
Wireshark uses the libpcap filter language for capture filters. A brief overview of the syntax follows. Complete documentation can be found in the pcap-filter man page. You can find a lot of Capture Filter examples at https://wiki.wireshark.org/CaptureFilters.
You enter the capture filter into the “Filter” field of the Wireshark “Capture Options” dialog box, as shown in Figure 4.3, “The “Capture Options” dialog box”.
A capture filter takes the form of a series of primitive expressions connected by conjunctions (and/or) and optionally preceded by not:
[not] primitive [and|or [not] primitive ...]
An example is shown in Example 4.1, “A capture filter for telnet that captures traffic to and from a particular host”.
Example 4.1. A capture filter for telnet that captures traffic to and from a particular host
A capture filter for telnet that captures traffic to and from a particular host
tcp port 23 and host 10.0.0.5
This example captures telnet traffic to and from the host 10.0.0.5, and shows how to use two primitives and the and conjunction. Another example is shown in Example 4.2, “Capturing all telnet traffic not from 10.0.0.5”, and shows how to capture all telnet traffic except that from 10.0.0.5.
Example 4.2. Capturing all telnet traffic not from 10.0.0.5
Capturing all telnet traffic not from 10.0.0.5
tcp port 23 and not src host 10.0.0.5
| A primitive is simply one of the following: *[src | dst] host <host>* |
| This primitive allows you to filter on a host IP address or name. You can optionally precede the primitive with the keyword *src | dst* to specify that you are only interested in source or destination addresses. If these are not present, packets where the specified address appears as either the source or the destination address will be selected. |
| *ether [src | dst] host <ehost>* |
| This primitive allows you to filter on Ethernet host addresses. You can optionally include the keyword *src | dst* between the keywords ether and host to specify that you are only interested in source or destination addresses. If these are not present, packets where the specified address appears in either the source or destination address will be selected. |
gateway host <host> This primitive allows you to filter on packets that used host as a gateway. That is, where the Ethernet source or destination was host but neither the source nor destination IP address was host.
| *[src | dst] net <net> [{mask <mask>} | {len <len>}]* |
| This primitive allows you to filter on network numbers. You can optionally precede this primitive with the keyword *src | dst* to specify that you are only interested in a source or destination network. If neither of these are present, packets will be selected that have the specified network in either the source or destination address. In addition, you can specify either the netmask or the CIDR prefix for the network if they are different from your own. |
| *[tcp | udp] [src | dst] port <port>* | ||
| This primitive allows you to filter on TCP and UDP port numbers. You can optionally precede this primitive with the keywords *src | dst* and *tcp | udp* which allow you to specify that you are only interested in source or destination ports and TCP or UDP packets respectively. The keywords *tcp | udp* must appear before *src | dst*. |
If these are not specified, packets will be selected for both the TCP and UDP protocols and when the specified address appears in either the source or destination port field.
less|greater <length> This primitive allows you to filter on packets whose length was less than or equal to the specified length, or greater than or equal to the specified length, respectively.
ip|ether proto <protocol> This primitive allows you to filter on the specified protocol at either the Ethernet layer or the IP layer.
ether|ip broadcast|multicast This primitive allows you to filter on either Ethernet or IP broadcasts or multicasts.
<expr> relop <expr> This primitive allows you to create complex filter expressions that select bytes or ranges of bytes in packets. Please see the pcap-filter man page at http://www.tcpdump.org/manpages/pcap-filter.7.html for more details.
Automatic Remote Traffic Filtering
If Wireshark is running remotely (using e.g. SSH, an exported X11 window, a terminal server, …), the remote content has to be transported over the network, adding a lot of (usually unimportant) packets to the actually interesting traffic.
To avoid this, Wireshark tries to figure out if it’s remotely connected (by looking at some specific environment variables) and automatically creates a capture filter that matches aspects of the connection.
The following environment variables are analyzed:
SSH_CONNECTION (ssh) <remote IP> <remote port> <local IP> <local port>
SSH_CLIENT (ssh) <remote IP> <remote port> <local port>
REMOTEHOST (tcsh, others?) <remote name>
DISPLAY (x11) [remote name]:<display num>
SESSIONNAME (terminal server) <remote name>
On Windows it asks the operating system if it’s running in a Remote Desktop Services environment.
Stop the running capture
A running capture session will be stopped in one of the following ways:
- Using the Stop button from the “Capture Info” dialog box.
The “Capture Info” dialog box might be hidden if the “Hide capture info dialog” option is used.
- Using the Capture → Stop menu item.
- Using the Stop toolbar button.
- Pressing Ctrl+E.
- The capture will be automatically stopped if one of the Stop Conditions is met, e.g. the maximum amount of data was captured.
Restart a running capture
A running capture session can be restarted with the same capture options as the last time, this will remove all packets previously captured. This can be useful, if some uninteresting packets are captured and there’s no need to keep them.
Restart is a convenience function and equivalent to a capture stop following by an immediate capture start. A restart can be triggered in one of the following ways:
- Using the Capture → Restart menu item.
- Using the Restart toolbar button.
Sources
- https://www.wireshark.org/docs/wsug_html/#ChapterCapture