Menus Wireshark
Texte en anglais
1. Démarrer Wireshark
Vous pouvez démarrer Wireshark depuis votre gestionnaire de fenêtre ou terminal.
Dans les chapitres suivants, beaucoup de captures d’écran de Wireshark seront affichées. Comme Wireshark fonctionne sur de nombreuses plates-formes différentes avec différents gestionnaires de fenêtres, différents styles appliqués et il existe différentes versions de la boîtes à outils GUI sous-jacente utilisée, votre écran peut être différent des captures d’écran fournies. Mais ceux-ci ne sont toujours pas compréhensibles.
2. The Main window
Regardons l’interface utilisateur de Wireshark. La Figure 3.1, “La fenêtre principale” montre Wireshark comme vous le verriez habituellement après que certains paquets sont capturés ou chargés (comment cela sera décrit plus loin).
Figure 3.1. La fenêtre principale
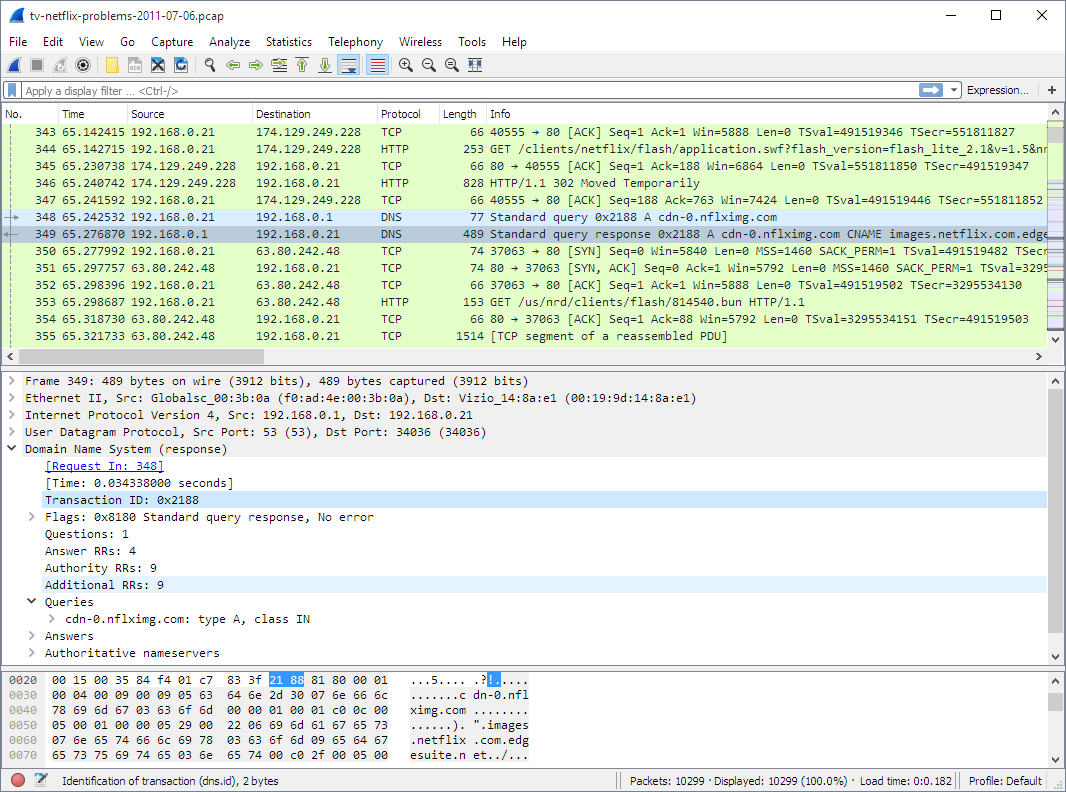
La fenêtre principale de Wireshark se compose de parties connues de plusieurs autres programmes GUI.
- Le menu sert à lancer des actions.
- La barre d’outils principale permet d’accéder rapidement aux éléments fréquemment utilisés dans le menu.
- La barre d’outils filter.
- Le volet liste des paquets affiche un résumé de chaque paquet capturé. En cliquant sur les paquets dans ce volet, vous contrôlez ce qui s’affiche dans les deux autres panneaux.
- Le volet des détails du paquet affiche le paquet sélectionné dans le volet de la liste des paquets plus en détail.
- Le volet paquets bytes affiche les données du paquet sélectionné dans le volet de la liste des paquets et met en surbrillance le champ sélectionné dans le volet des détails du paquet.
- La barre d’état montre des informations détaillées sur l’état actuel du programme et les données capturées.
The layout of the main window can be customized by changing preference settings.
Main Window Navigation
Packet list and detail navigation can be done entirely from the keyboard. Table 3.1, “Keyboard Navigation” shows a list of keystrokes that will let you quickly move around a capture file. for additional navigation keystrokes.
Table 3.1. Keyboard Navigation
| Accelerator | Description |
|---|---|
| Tab, Shift+Tab | Move between screen elements, e.g. from the toolbars to the packet list to the packet detail. |
| Down | Move to the next packet or detail item. |
| Up | Move to the previous packet or detail item. |
| Ctrl+Down, F8 | Move to the next packet, even if the packet list isn’t focused. |
| Ctrl+Up, F7 | Move to the previous packet, even if the packet list isn’t focused. |
| Ctrl+. | Move to the next packet of the conversation (TCP, UDP or IP). |
| Ctrl+, | Move to the previous packet of the conversation (TCP, UDP or IP). |
| Alt+Right or Option+Right (macOS) | Move to the next packet in the selection history. |
| Alt+Left or Option+Right (macOS) | Move to the previous packet in the selection history. |
| Left | In the packet detail, closes the selected tree item. If it’s already closed, jumps to the parent node. |
| Right | In the packet detail, opens the selected tree item. |
| Shift+Right | In the packet detail, opens the selected tree item and all of its subtrees. |
| Ctrl+Right | In the packet detail, opens all tree items. |
| Ctrl+Left | In the packet detail, closes all tree items. |
| Backspace | In the packet detail, jumps to the parent node. |
| Return, Enter | In the packet detail, toggles the selected tree item. |
Help → About Wireshark → Keyboard Shortcuts will show a list of all shortcuts in the main window. Additionally, typing anywhere in the main window will start filling in a display filter.
3. The Menu
Wireshark’s main menu is located either at the top of the main window (Windows, Linux) or at the top of your main screen (macOS). An example is shown in Figure 3.2, “The Menu”.
Some menu items will be disabled (greyed out( if the corresponding feature isn’t available. For example, you cannot save a capture file if you haven’t captured or loaded any packets.
Figure 3.2. The Menu

The main menu contains the following items:
File This menu contains items to open and merge capture files, save, print, or export capture files in whole or in part, and to quit the Wireshark application.
Edit This menu contains items to find a packet, time reference or mark one or more packets, handle configuration profiles, and set your preferences; (cut, copy, and paste are not presently implemented).
View This menu controls the display of the captured data, including colorization of packets, zooming the font, showing a packet in a separate window, expanding and collapsing trees in packet details, ….
Go This menu contains items to go to a specific packet.
Capture This menu allows you to start and stop captures and to edit capture filters.
Analyze This menu contains items to manipulate display filters, enable or disable the dissection of protocols, configure user specified decodes and follow a TCP stream.
Statistics This menu contains items to display various statistic windows, including a summary of the packets that have been captured, display protocol hierarchy statistics and much more.
Telephony This menu contains items to display various telephony related statistic windows, including a media analysis, flow diagrams, display protocol hierarchy statistics and much more.
Wireless The items in this menu show Bluetooth and IEEE 802.11 wireless statistics.
Tools This menu contains various tools available in Wireshark, such as creating Firewall ACL Rules.
Help This menu contains items to help the user, e.g. access to some basic help, manual pages of the various command line tools, online access to some of the webpages, and the usual about dialog.
Each of these menu items is described in more detail in the sections that follow.
Shortcuts make life easier
Most common menu items have keyboard shortcuts. For example, you can press the Control (or Strg in German) and the K keys together to open the “Capture Options” dialog.
3. The “File” menu
The Wireshark file menu contains the fields shown in Table 3.2, “File menu items”.
Figure 3.3. The “File” Menu
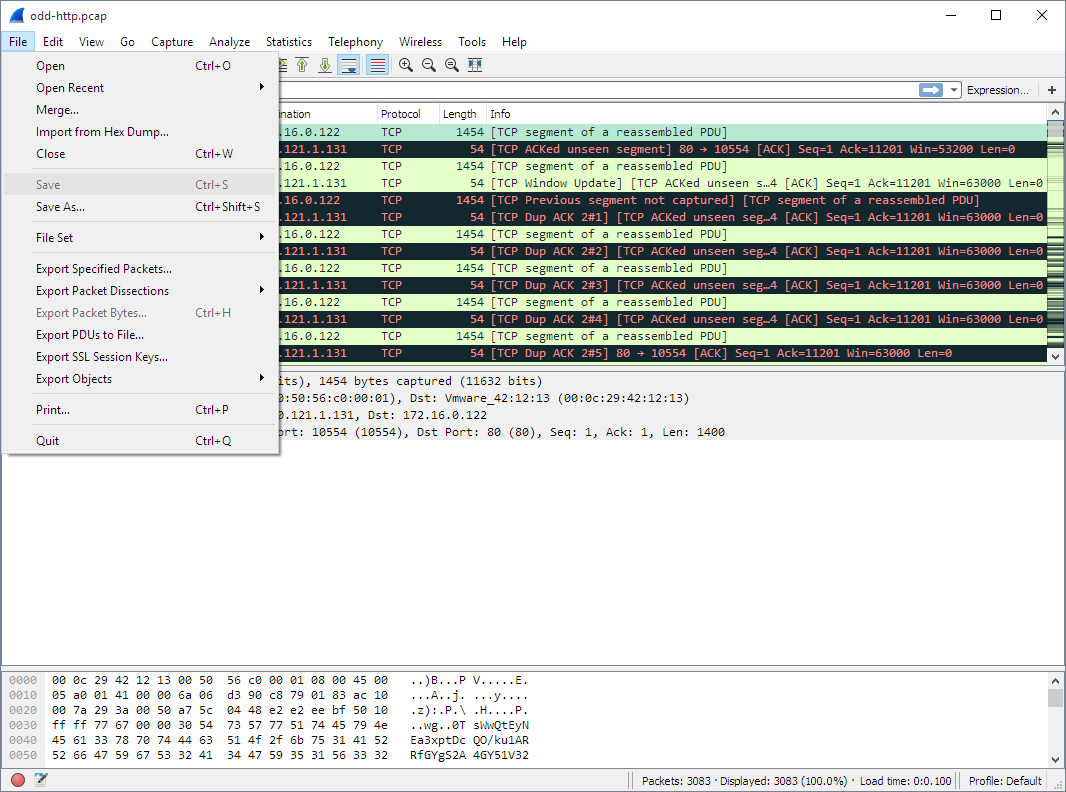
Table 3.2. File menu items
| Menu Item | Accelerator | Description |
|---|---|---|
| Open… | Ctrl+O | This shows the file open dialog box that allows you to load a capture file for viewing. It is discussed in more detail in Section 5.2.1, “The “Open Capture File” dialog box”. |
| Open Recent | This lets you open recently opened capture files. Clicking on one of the submenu items will open the corresponding capture file directly. | |
| Merge… | This menu item lets you merge a capture file into the currently loaded one. It is discussed in more detail in Section 5.4, “Merging capture files”. | |
| Import from Hex Dump… | This menu item brings up the import file dialog box that allows you to import a text file containing a hex dump into a new temporary capture. It is discussed in more detail in Section 5.5, “Import hex dump”. | |
| Close | Ctrl+W | This menu item closes the current capture. If you haven’t saved the capture, you will be asked to do so first (this can be disabled by a preference setting). |
| Save | Ctrl+S | This menu item saves the current capture. If you have not set a default capture file name (perhaps with the -w <capfile> option), Wireshark pops up the Save Capture File As dialog box (which is discussed further in Section 5.3.1, “The “Save Capture File As” dialog box”). If you have already saved the current capture, this menu item will be greyed out. You cannot save a live capture while the capture is in progress. You must stop the capture in order to save. |
| Save As… | Shift+Ctrl+S | This menu item allows you to save the current capture file to whatever file you would like. It pops up the Save Capture File As dialog box (which is discussed further in Section 5.3.1, “The “Save Capture File As” dialog box”). |
| File Set → List Files | This menu item allows you to show a list of files in a file set. It pops up the Wireshark List File Set dialog box (which is discussed further in Section 5.6, “File Sets”). | |
| File Set → Next File | If the currently loaded file is part of a file set, jump to the next file in the set. If it isn’t part of a file set or just the last file in that set, this item is greyed out. | |
| File Set → Previous File | If the currently loaded file is part of a file set, jump to the previous file in the set. If it isn’t part of a file set or just the first file in that set, this item is greyed out. | |
| Export Specified Packets… | This menu item allows you to export all (or some) of the packets in the capture file to file. It pops up the Wireshark Export dialog box (which is discussed further in Section 5.7, “Exporting data”). | |
| Export Packet Dissections… | Ctrl+H | These menu items allow you to export the currently selected bytes in the packet bytes pane to a text file file in a number of formats including plain, CSV, and XML. It is discussed further in Section 5.7.7, “The “Export selected packet bytes” dialog box”. |
| Export Objects | These menu items allow you to export captured DICOM, HTTP, SMB, or TFTP objects into local files. It pops up a corresponding object list (which is discussed further in Section 5.7.8, “The “Export Objects” dialog box”) | |
| Print… | Ctrl+P | This menu item allows you to print all (or some) of the packets in the capture file. It pops up the Wireshark Print dialog box (which is discussed further in Section 5.8, “Printing packets”). |
| Quit | Ctrl+Q | This menu item allows you to quit from Wireshark. Wireshark will ask to save your capture file if you haven’t previously saved it (this can be disabled by a preference setting). |
### The “Edit” menu
The Wireshark Edit menu contains the fields shown in Table 3.3, “Edit menu items”.
Figure 3.4. The “Edit” Menu
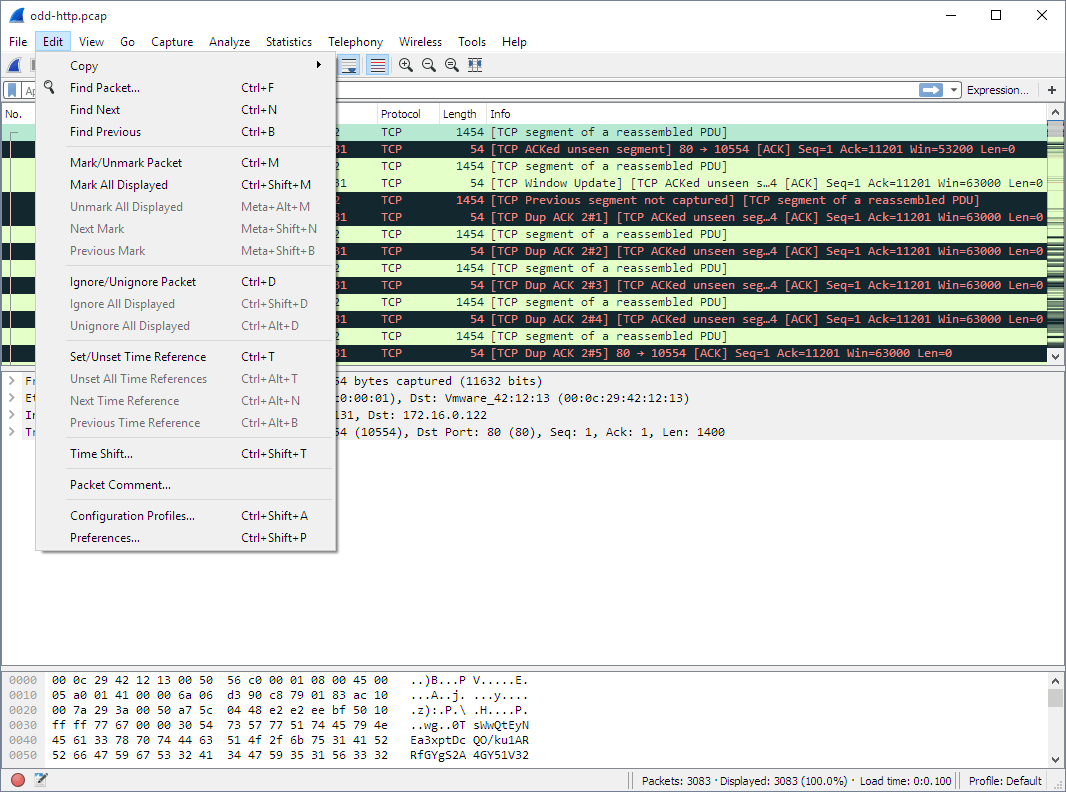
Table 3.3. Edit menu items
| Menu Item | Accelerator | Description |
|---|---|---|
| Copy | These menu items will copy the packet list, packet detail, or properties of the currently selected packet to the clipboard. | |
| Find Packet… | Ctrl+F | This menu item brings up a toolbar that allows you to find a packet by many criteria. There is further information on finding packets in Section 6.8, “Finding packets”. |
| Find Next | Ctrl+N | This menu item tries to find the next packet matching the settings from “Find Packet…”. |
| Find Previous | Ctrl+B | This menu item tries to find the previous packet matching the settings from “Find Packet…”. |
| Mark/Unmark Packet | Ctrl+M | This menu item marks the currently selected packet. for details. |
| Mark All Displayed Packets | Shift+Ctrl+M | This menu item marks all displayed packets. |
| Unmark All Displayed Packets | Ctrl+Alt+M | This menu item unmarks all displayed packets. |
| Next Mark | Shift+Alt+N | Find the next marked packet. |
| Previous Mark | Shift+Alt+B | Find the previous marked packet. |
| Ignore/Unignore Packet | Ctrl+D | This menu item marks the currently selected packet as ignored. for details. |
| Ignore All Displayed | Shift+Ctrl+D | This menu item marks all displayed packets as ignored. |
| Unignore All Displayed | Ctrl+Alt+D | This menu item unmarks all ignored packets. |
| Set/Unset Time Reference | Ctrl+T | This menu item set a time reference on the currently selected packet. for more information about the time referenced packets. |
| Unset All Time References | Ctrl+Alt+T | This menu item removes all time references on the packets. |
| Next Time Reference | Ctrl+Alt+N | This menu item tries to find the next time referenced packet. |
| Previous Time Reference | Ctrl+Alt+B | This menu item tries to find the previous time referenced packet. |
| Time Shift | Ctrl+Shift+T | This will show the Time Shift dialog, which allows you to adjust the timestamps of some or all packets. |
| Packet Comment… | This will let you add a comment to a single packet. Note that the ability to save packet comments depends on your file format. E.g. pcapng supports comments, pcap does not. | |
| Capture Comment… | This will let you add a capture comment. Note that the ability to save capture comments depends on your file format. E.g. pcapng supports comments, pcap does not. | |
| Configuration Profiles… | Shift+Ctrl+A | This menu item brings up a dialog box for handling configuration profiles. More detail is provided in Section 10.6, “Configuration Profiles”. |
| Preferences… | Shift+Ctrl+P or Cmd+** (macOS) | This menu item brings up a dialog box that allows you to set preferences for many parameters that control Wireshark. You can also save your preferences so Wireshark will use them the next time you start it. More detail is provided in Section 10.5, “Preferences”. |
### The “View” menu
The Wireshark View menu contains the fields shown in Table 3.4, “View menu items”.
Figure 3.5. The “View” Menu
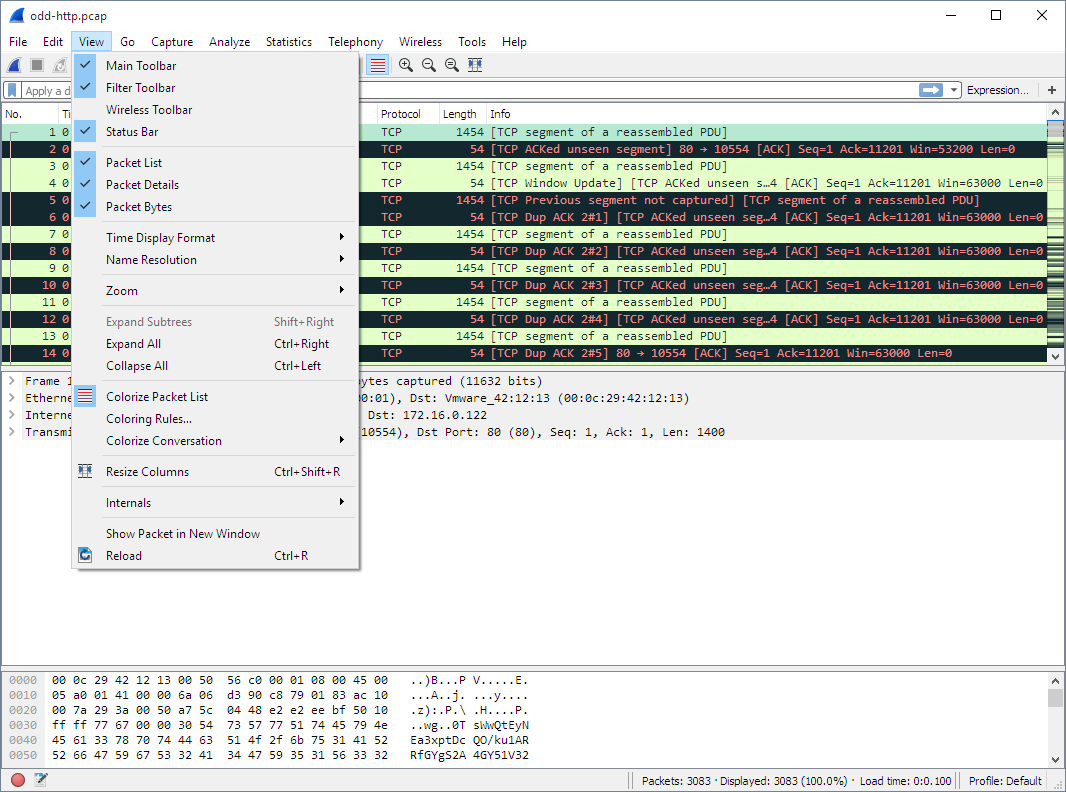
Table 3.4. View menu items
| Menu Item | Accelerator | Description |
|---|---|---|
| Main Toolbar | This menu item hides or shows the main toolbar, . | |
| Filter Toolbar | This menu item hides or shows the filter toolbar, . | |
| Wireless Toolbar | This menu item hides or shows the wireless toolbar. May not be present on some platforms. | |
| Statusbar | This menu item hides or shows the statusbar, . | |
| Packet List | This menu item hides or shows the packet list pane, . | |
| Packet Details | This menu item hides or shows the packet details pane, . | |
| Packet Bytes | This menu item hides or shows the packet bytes pane, . | |
| Time Display Format → Date and Time of Day: 1970-01-01 01:02:03.123456 | Selecting this tells Wireshark to display the time stamps in date and time of day format, . The fields “Time of Day”, “Date and Time of Day”, “Seconds Since Beginning of Capture”, “Seconds Since Previous Captured Packet” and “Seconds Since Previous Displayed Packet” are mutually exclusive. | |
| Time Display Format → Time of Day: 01:02:03.123456 | Selecting this tells Wireshark to display time stamps in time of day format, . | |
| Time Display Format → Seconds Since Epoch (1970-01-01): 1234567890.123456 | Selecting this tells Wireshark to display time stamps in seconds since 1970-01-01 00:00:00, . | |
| Time Display Format → Seconds Since Beginning of Capture: 123.123456 | Selecting this tells Wireshark to display time stamps in seconds since beginning of capture format, . | |
| Time Display Format → Seconds Since Previous Captured Packet: 1.123456 | Selecting this tells Wireshark to display time stamps in seconds since previous captured packet format, . | |
| Time Display Format → Seconds Since Previous Displayed Packet: 1.123456 | Selecting this tells Wireshark to display time stamps in seconds since previous displayed packet format, . | |
| Time Display Format → Automatic (File Format Precision) | Selecting this tells Wireshark to display time stamps with the precision given by the capture file format used, . The fields “Automatic”, “Seconds” and “…seconds” are mutually exclusive. | |
| Time Display Format → Seconds: 0 | Selecting this tells Wireshark to display time stamps with a precision of one second, . | |
| Time Display Format → …seconds: 0…. | Selecting this tells Wireshark to display time stamps with a precision of one second, decisecond, centisecond, millisecond, microsecond or nanosecond, . | |
| Time Display Format → Display Seconds with hours and minutes | Selecting this tells Wireshark to display time stamps in seconds, with hours and minutes. | |
| Name Resolution → Resolve Name | This item allows you to trigger a name resolve of the current packet only, . | |
| Name Resolution → Enable for MAC Layer | This item allows you to control whether or not Wireshark translates MAC addresses into names, . | |
| Name Resolution → Enable for Network Layer | This item allows you to control whether or not Wireshark translates network addresses into names, . | |
| Name Resolution → Enable for Transport Layer | This item allows you to control whether or not Wireshark translates transport addresses into names, . | |
| Colorize Packet List | This item allows you to control whether or not Wireshark should colorize the packet list. Enabling colorization will slow down the display of new packets while capturing / loading capture files. | |
| Auto Scroll in Live Capture | This item allows you to specify that Wireshark should scroll the packet list pane as new packets come in, so you are always looking at the last packet. If you do not specify this, Wireshark simply adds new packets onto the end of the list, but does not scroll the packet list pane. | |
| Zoom In | Ctrl++ | Zoom into the packet data (increase the font size). |
| Zoom Out | Ctrl+- | Zoom out of the packet data (decrease the font size). |
| Normal Size | Ctrl+= | Set zoom level back to 100% (set font size back to normal). |
| Resize All Columns | Shift+Ctrl+R | Resize all column widths so the content will fit into it. Resizing may take a significant amount of time, especially if a large capture file is loaded. |
| Displayed Columns | This menu items folds out with a list of all configured columns. These columns can now be shown or hidden in the packet list. | |
| Expand Subtrees | Shift+→ | This menu item expands the currently selected subtree in the packet details tree. |
| Collapse Subtrees | Shift+← | This menu item collapses the currently selected subtree in the packet details tree. |
| Expand All | Ctrl+→ | Wireshark keeps a list of all the protocol subtrees that are expanded, and uses it to ensure that the correct subtrees are expanded when you display a packet. This menu item expands all subtrees in all packets in the capture. |
| Collapse All | Ctrl+← | This menu item collapses the tree view of all packets in the capture list. |
| Colorize Conversation | This menu item brings up a submenu that allows you to color packets in the packet list pane based on the addresses of the currently selected packet. This makes it easy to distinguish packets belonging to different conversations. Section 10.3, “Packet colorization”. | |
| Colorize Conversation → Color 1-10 | These menu items enable one of the ten temporary color filters based on the currently selected conversation. | |
| Colorize Conversation → Reset coloring | This menu item clears all temporary coloring rules. | |
| Colorize Conversation → New Coloring Rule… | This menu item opens a dialog window in which a new permanent coloring rule can be created based on the currently selected conversation. | |
| Coloring Rules… | This menu item brings up a dialog box that allows you to color packets in the packet list pane according to filter expressions you choose. It can be very useful for spotting certain types of packets, . | |
| Show Packet in New Window | This menu item brings up the selected packet in a separate window. The separate window shows only the tree view and byte view panes. | |
| Reload | Ctrl+R | This menu item allows you to reload the current capture file. |
The “Go” menu
The Wireshark Go menu contains the fields shown in Table 3.5, “Go menu items”.
Figure 3.6. The “Go” Menu
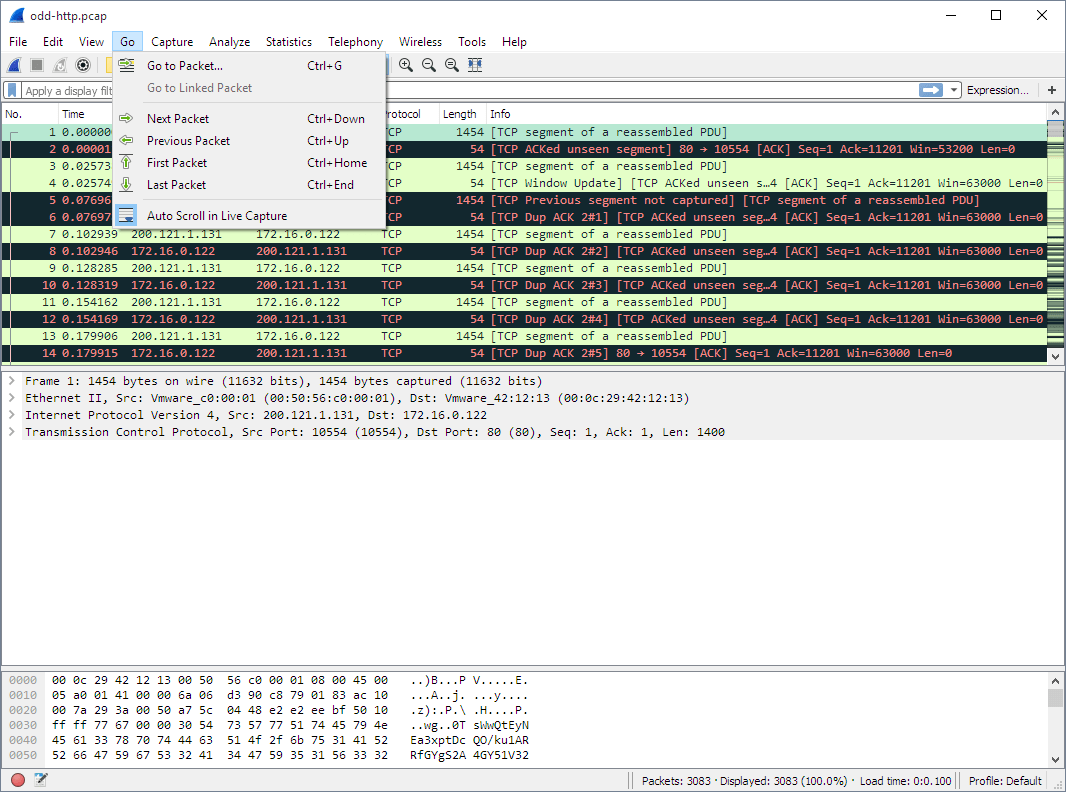
Table 3.5. Go menu items
| Menu Item | Accelerator | Description |
|---|---|---|
| Back | Alt+← | Jump to the recently visited packet in the packet history, much like the page history in a web browser. |
| Forward | Alt+→ | Jump to the next visited packet in the packet history, much like the page history in a web browser. |
| Go to Packet… | Ctrl+G | Bring up a window frame that allows you to specify a packet number, and then goes to that packet. for details. |
| Go to Corresponding Packet | Go to the corresponding packet of the currently selected protocol field. If the selected field doesn’t correspond to a packet, this item is greyed out. | |
| Previous Packet | Ctrl+↑ | Move to the previous packet in the list. This can be used to move to the previous packet even if the packet list doesn’t have keyboard focus. |
| Next Packet | Ctrl+↓ | Move to the next packet in the list. This can be used to move to the previous packet even if the packet list doesn’t have keyboard focus. |
| First Packet | Ctrl+Home | Jump to the first packet of the capture file. |
| Last Packet | Ctrl+End | Jump to the last packet of the capture file. |
| Previous Packet In Conversation | Ctrl+, | Move to the previous packet in the current conversation. This can be used to move to the previous packet even if the packet list doesn’t have keyboard focus. |
| Next Packet In Conversation | Ctrl+. | Move to the next packet in the current conversation. This can be used to move to the previous packet even if the packet list doesn’t have keyboard focus. |
### The “Capture” menu
The Wireshark Capture menu contains the fields shown in Table 3.6, “Capture menu items”.
Figure 3.7. The “Capture” Menu
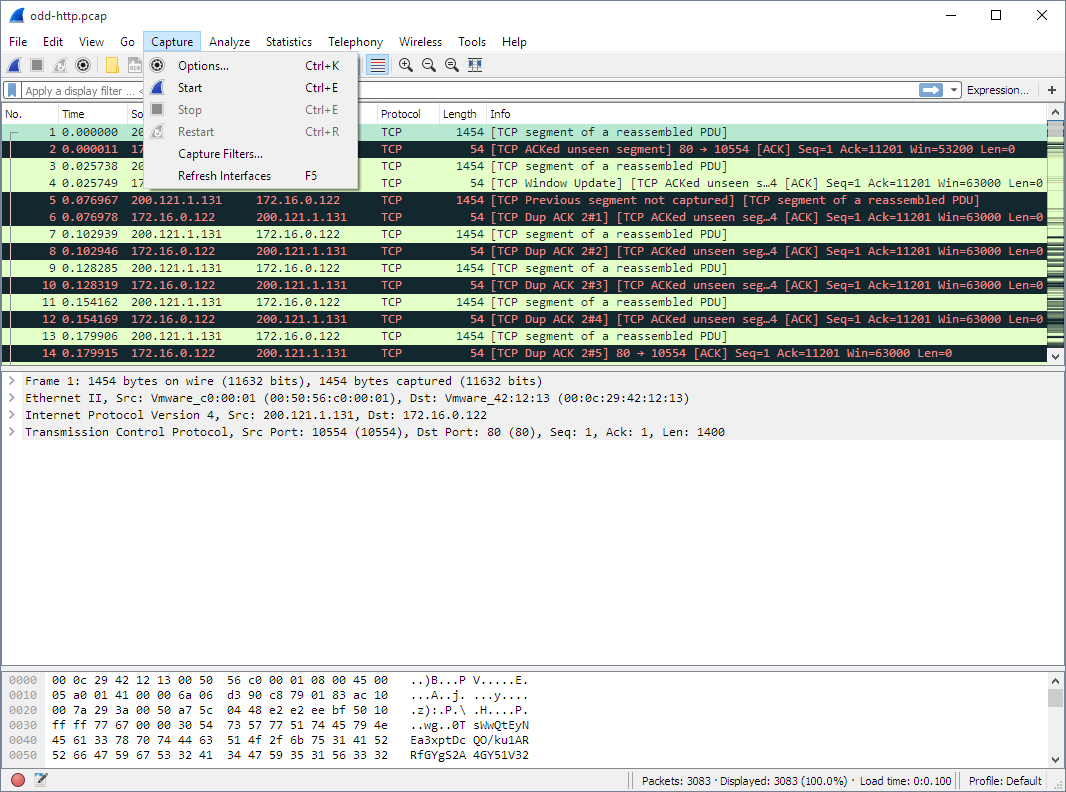
Table 3.6. Capture menu items
| Menu Item | Accelerator | Description |
|---|---|---|
| Interfaces… | Ctrl+I | This menu item brings up a dialog box that shows what’s going on at the network interfaces Wireshark knows of, ) . |
| Options… | Ctrl+K | This menu item brings up the Capture Options dialog box (discussed further in Section 4.5, “The “Capture Options” dialog box”) and allows you to start capturing packets. |
| Start | Ctrl+E | Immediately start capturing packets with the same settings than the last time. |
| Stop | Ctrl+E | This menu item stops the currently running capture, ) . |
| Restart | Ctrl+R | This menu item stops the currently running capture and starts again with the same options, this is just for convenience. |
| Capture Filters… | This menu item brings up a dialog box that allows you to create and edit capture filters. You can name filters, and you can save them for future use. More detail on this subject is provided in Section 6.6, “Defining and saving filters” |
### The “Analyze” menu
The Wireshark Analyze menu contains the fields shown in Table 3.7, “Analyze menu items”.
Figure 3.8. The “Analyze” Menu
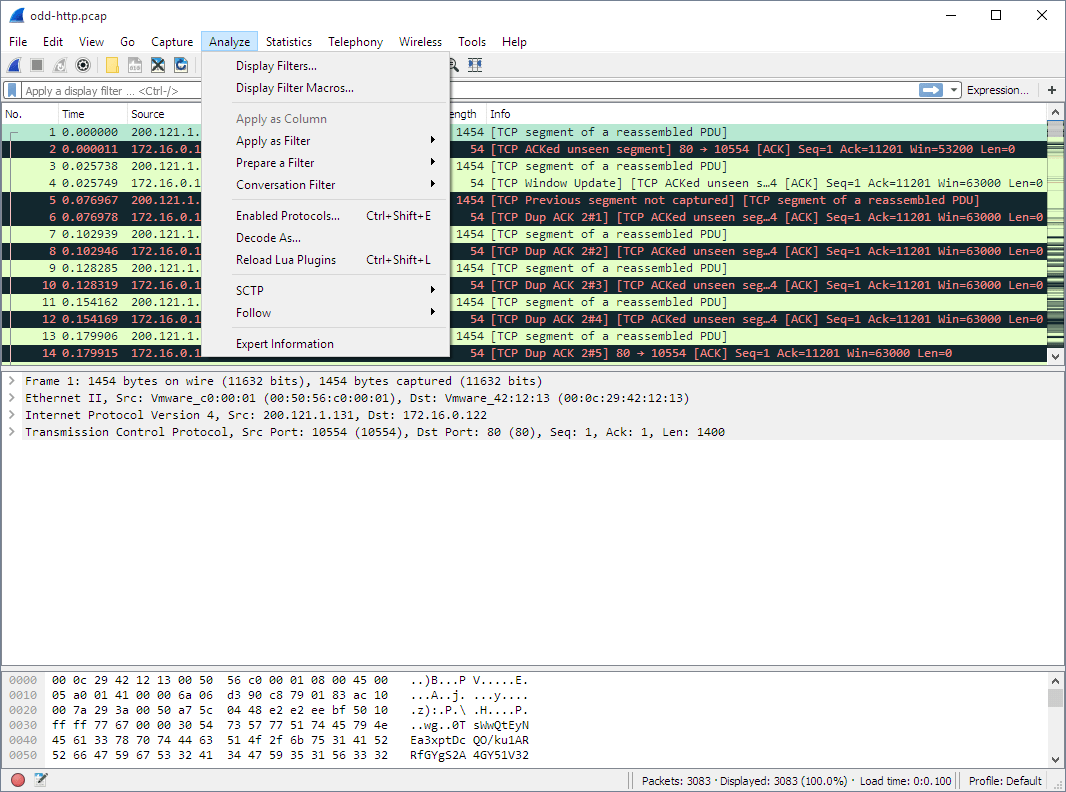
Table 3.7. Analyze menu items
| Menu Item | Accelerator | Description |
|---|---|---|
| Display Filters… | This menu item brings up a dialog box that allows you to create and edit display filters. You can name filters, and you can save them for future use. More detail on this subject is provided in Section 6.6, “Defining and saving filters” | |
| Display Filter Macros… | This menu item brings up a dialog box that allows you to create and edit display filter macros. You can name filter macros, and you can save them for future use. More detail on this subject is provided in Section 6.7, “Defining and saving filter macros” | |
| Apply as Column | This menu item adds the selected protocol item in the packet details pane as a column to the packet list. | |
| Apply as Filter → … | These menu items will change the current display filter and apply the changed filter immediately. Depending on the chosen menu item, the current display filter string will be replaced or appended to by the selected protocol field in the packet details pane. | |
| Prepare a Filter → … | These menu items will change the current display filter but won’t apply the changed filter. Depending on the chosen menu item, the current display filter string will be replaced or appended to by the selected protocol field in the packet details pane. | |
| Enabled Protocols… | Shift+Ctrl+E | This menu item allows the user to enable/disable protocol dissectors, |
| Decode As… | This menu item allows the user to force Wireshark to decode certain packets as a particular protocol, | |
| User Specified Decodes… | This menu item allows the user to force Wireshark to decode certain packets as a particular protocol, | |
| Follow TCP Stream | This menu item brings up a separate window and displays all the TCP segments captured that are on the same TCP connection as a selected packet, | |
| Follow UDP Stream | Same functionality as “Follow TCP Stream” but for UDP streams. | |
| Follow SSL Stream | Same functionality as “Follow TCP Stream” but for SSL streams. See the wiki page on SSL for instructions on providing SSL keys. | |
| Expert Info | Open a dialog showing some expert information about the captured packets. The amount of information will depend on the protocol and varies from very detailed to non-existent. XXX - add a new section about this and link from here | |
| Conversation Filter → … | In this menu you will find conversation filter for various protocols. |
### The “Statistics” menu
The Wireshark Statistics menu contains the fields shown in Table 3.8, “Statistics menu items”.
Figure 3.9. The “Statistics” Menu
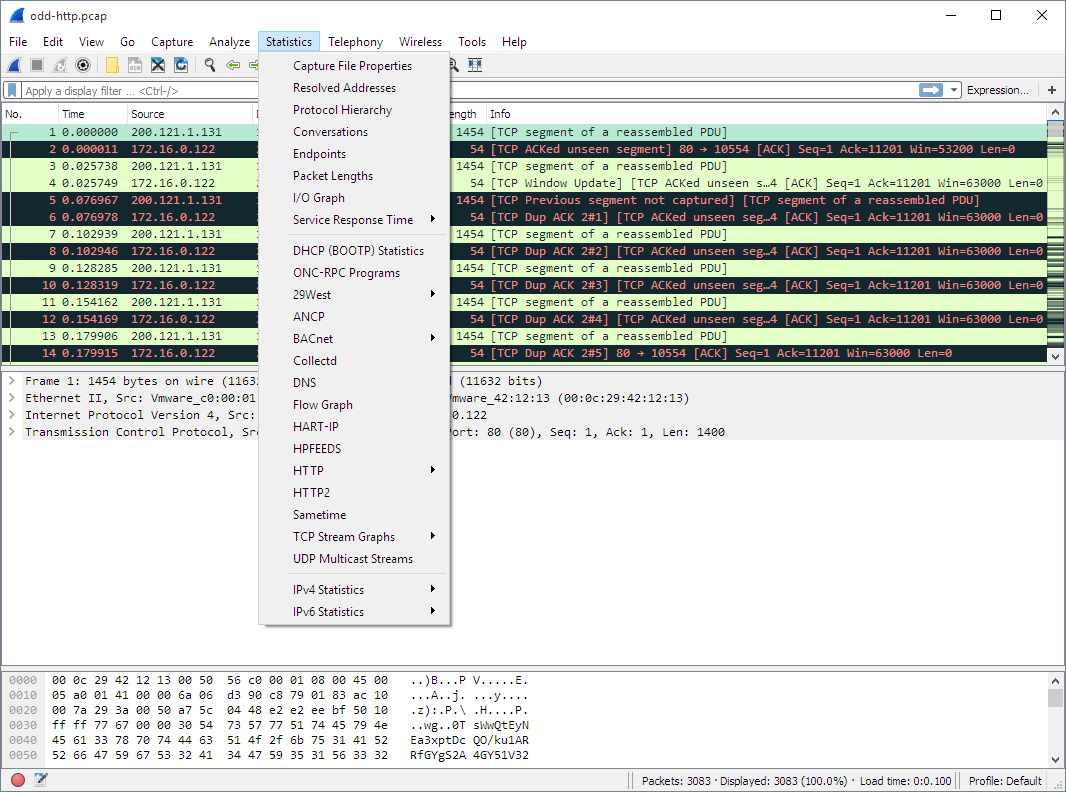
All menu items will bring up a new window showing specific statistical information.
Table 3.8. Statistics menu items
| Menu Item | Accelerator | Description |
|---|---|---|
| Summary | Show information about the data captured, . | |
| Protocol Hierarchy | Display a hierarchical tree of protocol statistics, . | |
| Conversations | Display a list of conversations (traffic between two endpoints), . | |
| Endpoints | Display a list of endpoints (traffic to/from an address), . | |
| Packet Lengths… | ||
| IO Graphs | Display user specified graphs (e.g. the number of packets in the course of time), . | |
| Service Response Time | Display the time between a request and the corresponding response, . | |
| ANCP | ||
| Colledtd… | ||
| Compare… | ||
| Flow Graph… | ||
| HTTP | HTTP request/response statistics, | |
| IP Addresses… | ||
| IP Destinations… | ||
| IP Protocol Types… | ||
| ONC-RPC Programs | ||
| Sametime | ||
| TCP Stream Graph | ||
| UDP Multicast Streams | ||
| WLAN Traffic | ||
| BOOTP-DHCP |
### The “Telephony” menu
The Wireshark Telephony menu contains the fields shown in Table 3.9, “Telephony menu items”.
Figure 3.10. The “Telephony” Menu
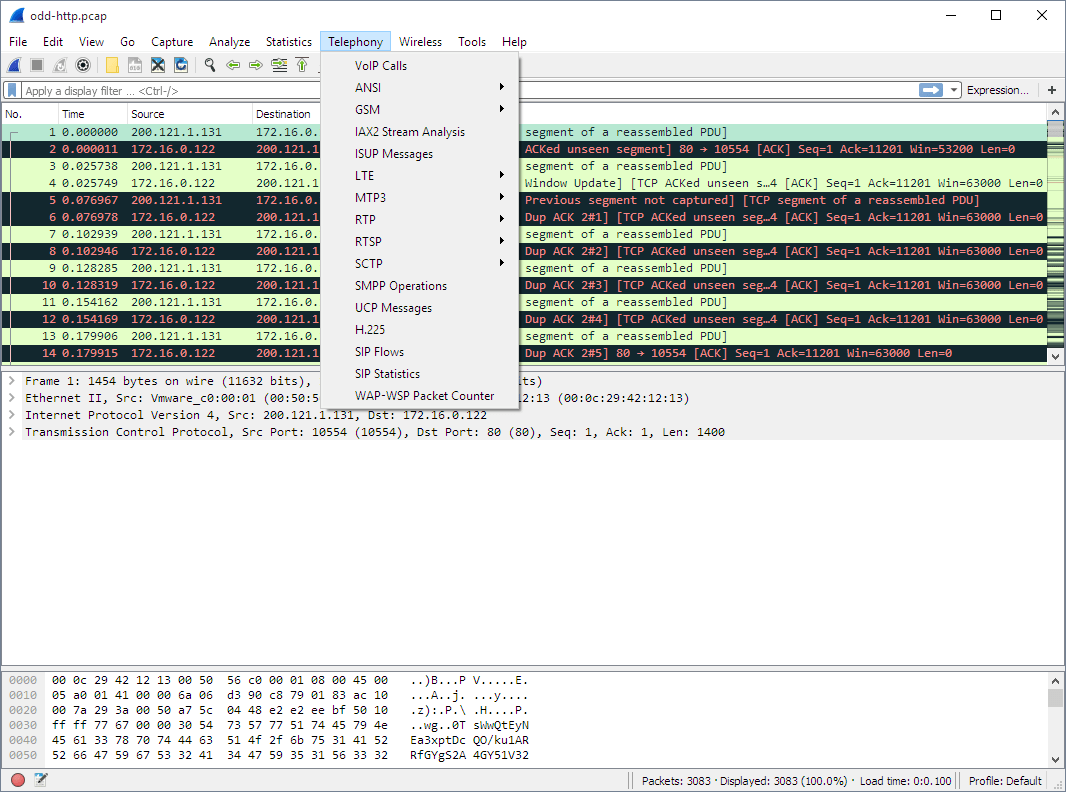
All menu items will bring up a new window showing specific telephony related statistical information.
Table 3.9. Telephony menu items
| Menu Item | Accelerator | Description |
|---|---|---|
| IAX2 | ||
| SMPP Operations… | ||
| SCTP | ||
| ANSI | ||
| GSM | ||
| H.225… | ||
| ISUP Messages… | ||
| LTE | ||
| MTP3 | ||
| RTP | ||
| SIP… | ||
| UCP Messages… | ||
| VoIP Calls… | ||
| WAP-WSP… |
### The “Tools” menu
The Wireshark Tools menu contains the fields shown in Table 3.10, “Tools menu items”.
Figure 3.11. The “Tools” Menu
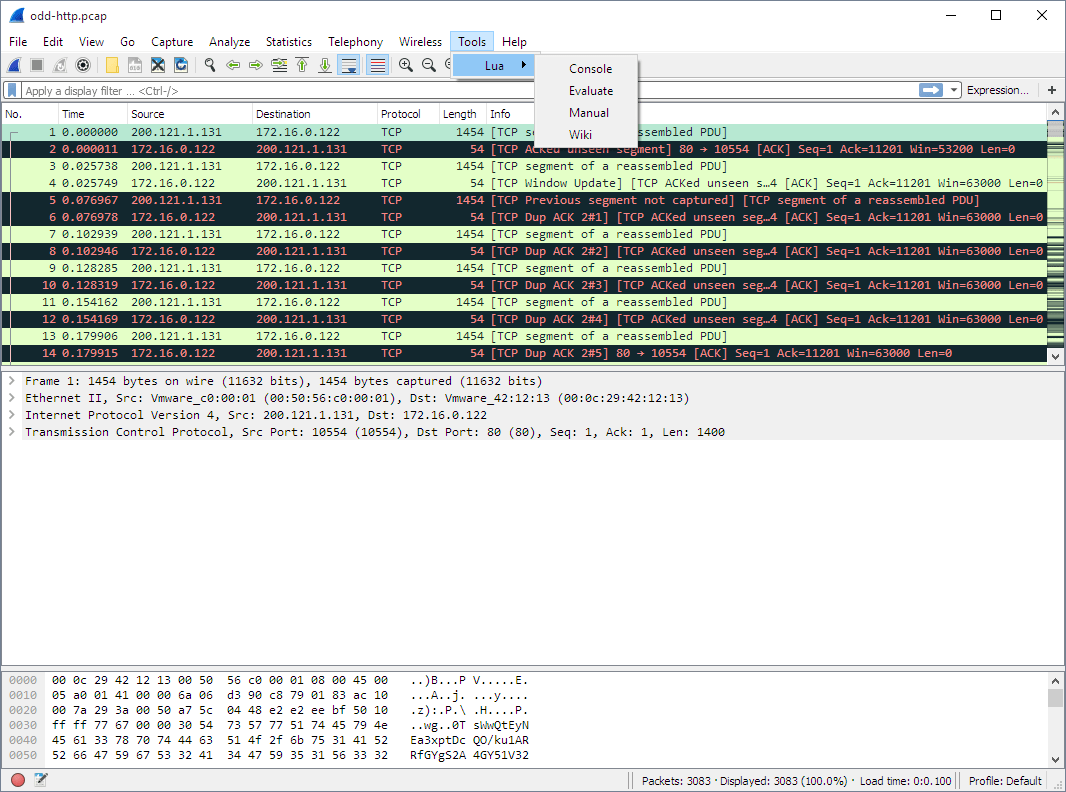
Table 3.10. Tools menu items
| Menu Item | Accelerator | Description |
|---|---|---|
| Firewall ACL Rules | This allows you to create command-line ACL rules for many different firewall products, including Cisco IOS, Linux Netfilter (iptables), OpenBSD pf and Windows Firewall (via netsh). Rules for MAC addresses, IPv4 addresses, TCP and UDP ports, and IPv4+port combinations are supported. It is assumed that the rules will be applied to an outside interface. | |
| Lua | These options allow you to work with the Lua interpreter optionally build into Wireshark. See the “Lua Support in Wireshark” in the Wireshark Developer’s Guide. |
### The “Internals” menu
The Wireshark Internals menu contains the fields shown in Table 3.11, “Internals menu items”.
Figure 3.12. The “Internals” Menu
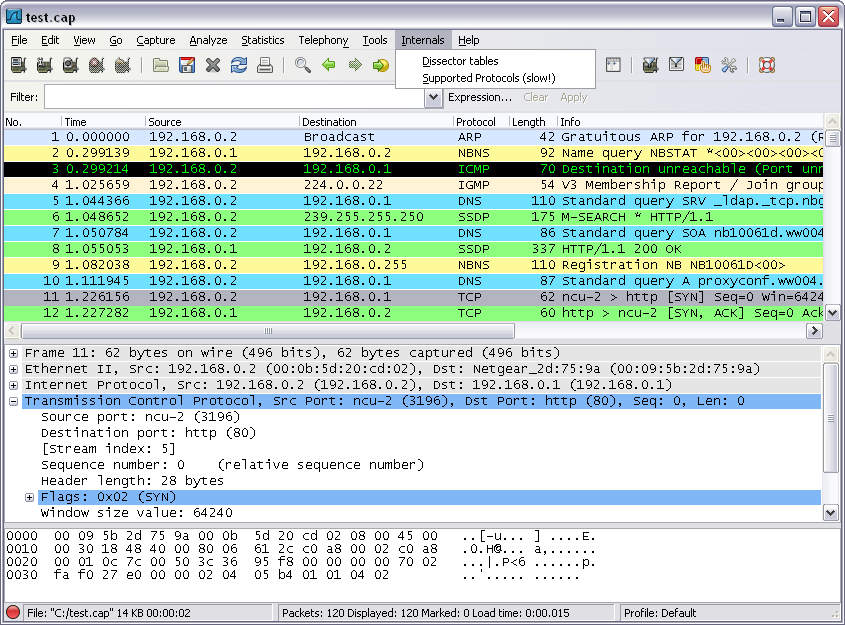
Table 3.11. Internals menu items
| Menu Item | Accelerator | Description |
|---|---|---|
| Dissector tables | This menu item brings up a dialog box showing the tables with subdissector relationships. | |
| Supported Protocols (slow!) | This menu item brings up a dialog box showing the supported protocols and protocol fields. |
### The “Help” menu
The Wireshark Help menu contains the fields shown in Table 3.12, “Help menu items”.
Figure 3.13. The “Help” Menu
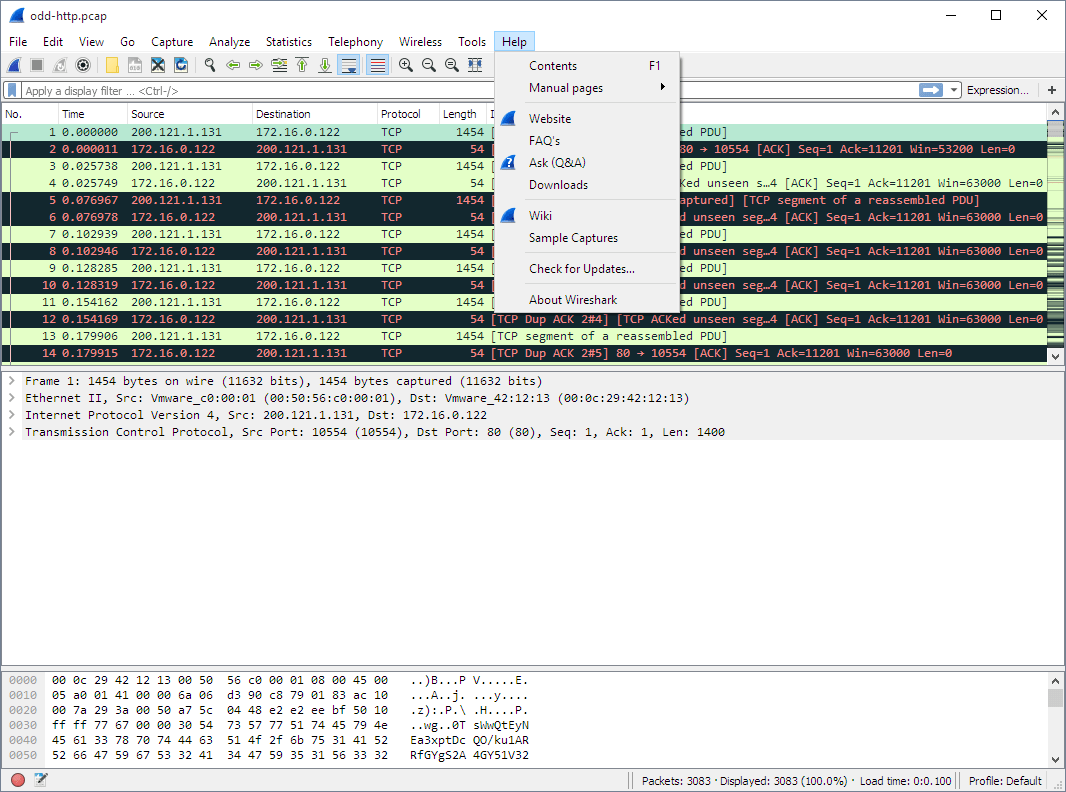
Table 3.12. Help menu items
| Menu Item | Accelerator | Description |
|---|---|---|
| Contents | F1 | This menu item brings up a basic help system. |
| Manual Pages → … | This menu item starts a Web browser showing one of the locally installed html manual pages. | |
| Website | This menu item starts a Web browser showing the webpage from: https://www.wireshark.org/. | |
| FAQ’s | This menu item starts a Web browser showing various FAQ’s. | |
| Downloads | This menu item starts a Web browser showing the downloads from: https://www.wireshark.org/download.html. | |
| Wiki | This menu item starts a Web browser showing the front page from: https://wiki.wireshark.org/. | |
| Sample Captures | This menu item starts a Web browser showing the sample captures from: https://wiki.wireshark.org/SampleCaptures. | |
| About Wireshark | This menu item brings up an information window that provides various detailed information items on Wireshark, such as how it’s build, the plugins loaded, the used folders, … |
Opening a Web browser might be unsupported in your version of Wireshark. If this is the case the corresponding menu items will be hidden.
If calling a Web browser fails on your machine, nothing happens, or the browser starts but no page is shown, have a look at the web browser setting in the preferences dialog.
4. Toolbars
The “Main” toolbar
The main toolbar provides quick access to frequently used items from the menu. This toolbar cannot be customized by the user, but it can be hidden using the View menu, if the space on the screen is needed to show even more packet data.
As in the menu, only the items useful in the current program state will be available. The others will be greyed out (e.g. you cannot save a capture file if you haven’t loaded one).
Figure 3.14. The “Main” toolbar

Table 3.13. Main toolbar items
| Toolbar Icon | Toolbar Item | Menu Item | Description |
|---|---|---|---|
| Capture → Interfaces… | This item brings up the Capture Interfaces List dialog box (discussed further in [Section 4.3, “Start Capturing”</figcaption></figure>). | ||
| Capture → Options… | This item brings up the Capture Options dialog box (discussed further in [Section 4.3, “Start Capturing”</figcaption></figure>) and allows you to start capturing packets. | ||
 <figcaption></figcaption> <figcaption></figcaption> | Capture → Start | This item starts capturing packets with the options form the last time. | |
| Capture → Stop | This item stops the currently running live capture process [Section 4.3, “Start Capturing”</figcaption></figure>). | ||
 <figcaption></figcaption> <figcaption></figcaption> | Capture → Restart | This item stops the currently running live capture process and restarts it again, for convenience. | |
| File → Open… | This item brings up the file open dialog box that allows you to load a capture file for viewing. It is discussed in more detail in [Section 5.2.1, “The “Open Capture File” dialog box”</figcaption></figure>. | ||
| File → Save As… | This item allows you to save the current capture file to whatever file you would like. It pops up the Save Capture File As dialog box (which is discussed further in [Section 5.3.1, “The “Save Capture File As” dialog box”</figcaption></figure>). If you currently have a temporary capture file, the Save icon will be shown instead. | ||
 <figcaption></figcaption> <figcaption></figcaption> | File → Close | This item closes the current capture. If you have not saved the capture, you will be asked to save it first. | |
 <figcaption></figcaption> <figcaption></figcaption> | View → Reload | This item allows you to reload the current capture file. | |
| File → Print… | This item allows you to print all (or some of) the packets in the capture file. It pops up the Wireshark Print dialog box (which is discussed further in [Section 5.8, “Printing packets”</figcaption></figure>). | ||
| Edit → Find Packet… | This item brings up a dialog box that allows you to find a packet. There is further information on finding packets in [Section 6.8, “Finding packets”</figcaption></figure>. | ||
| Go → Go Back | This item jumps back in the packet history. Hold down the Alt key (Option on macOS) to go back in the selection history. | ||
| Go → Go Forward | This item jumps forward in the packet history. Hold down the Alt key (Option on macOS) to go forward in the selection history. | ||
 <figcaption></figcaption> <figcaption></figcaption> | Go → Go to Packet… | This item brings up a dialog box that allows you to specify a packet number to go to that packet. | |
 <figcaption></figcaption> <figcaption></figcaption> | Go → First Packet | This item jumps to the first packet of the capture file. | |
 <figcaption></figcaption> <figcaption></figcaption> | Go → Last Packet | This item jumps to the last packet of the capture file. | |
 <figcaption></figcaption> <figcaption></figcaption> | View → Colorize | Colorize the packet list (or not). | |
 <figcaption></figcaption> <figcaption></figcaption> | View → Auto Scroll in Live Capture | Auto scroll packet list while doing a live capture (or not). | |
 <figcaption></figcaption> <figcaption></figcaption> | View → Zoom In | Zoom into the packet data (increase the font size). | |
| <figcaption></figcaption> | View → Zoom Out | Zoom out of the packet data (decrease the font size). | |
 <figcaption></figcaption> <figcaption></figcaption> | View → Normal Size | Set zoom level back to 100%. | |
 <figcaption></figcaption> <figcaption></figcaption> | View → Resize Columns | Resize columns, so the content fits into them. | |
| Capture → Capture Filters… | This item brings up a dialog box that allows you to create and edit capture filters. You can name filters, and you can save them for future use. More detail on this subject is provided in [Section 6.6, “Defining and saving filters”</figcaption></figure>. | ||
| Analyze → Display Filters… | This item brings up a dialog box that allows you to create and edit display filters. You can name filters, and you can save them for future use. More detail on this subject is provided in [Section 6.6, “Defining and saving filters”</figcaption></figure>. | ||
| View → Coloring Rules… | This item brings up a dialog box that allows you to color packets in the packet list pane according to filter expressions you choose. It can be very useful for spotting certain types of packets. More detail on this subject is provided in [Section 10.3, “Packet colorization”</figcaption></figure>. | ||
| Edit → Preferences | This item brings up a dialog box that allows you to set preferences for many parameters that control Wireshark. You can also save your preferences so Wireshark will use them the next time you start it. More detail is provided in [Section 10.5, “Preferences”</figcaption></figure> | ||
 <figcaption></figcaption> <figcaption></figcaption> | Help → Contents | This item brings up help dialog box. |
### The “Filter” toolbar
The filter toolbar lets you quickly edit and apply display filters. More information on display filters is available in Section 6.3, “Filtering packets while viewing”.
Figure 3.15. The “Filter” toolbar

Table 3.14. Filter toolbar items
| Toolbar Icon | Toolbar Item | Description |
|---|---|---|
| Brings up the filter construction dialog, described in [Figure 6.8, “The “Capture Filters” and “Display Filters” dialog boxes”</figcaption></figure>. | ||
| Filter input | The area to enter or edit a display filter string, . A syntax check of your filter string is done while you are typing. The background will turn red if you enter an incomplete or invalid string, and will become green when you enter a valid string. You can click on the pull down arrow to select a previously-entered filter string from a list. The entries in the pull down list will remain available even after a program restart. After you’ve changed something in this field, don’t forget to press the Apply button (or the Enter/Return key), to apply this filter string to the display. This field is also where the current filter in effect is displayed. | |
| The middle button labeled “Add Expression…” opens a dialog box that lets you edit a display filter from a list of protocol fields, described in [Section 6.5, “The “Filter Expression” dialog box”</figcaption></figure> | ||
| Reset the current display filter and clears the edit area. | ||
 <figcaption></figcaption> <figcaption></figcaption> | Apply the current value in the edit area as the new display filter. Applying a display filter on large capture files might take quite a long time. |
5. Panes
### The “Packet List” pane
The packet list pane displays all the packets in the current capture file.
Figure 3.16. The “Packet List” pane

Each line in the packet list corresponds to one packet in the capture file. If you select a line in this pane, more details will be displayed in the “Packet Details” and “Packet Bytes” panes.
While dissecting a packet, Wireshark will place information from the protocol dissectors into the columns. As higher level protocols might overwrite information from lower levels, you will typically see the information from the highest possible level only.
For example, let’s look at a packet containing TCP inside IP inside an Ethernet packet. The Ethernet dissector will write its data (such as the Ethernet addresses), the IP dissector will overwrite this by its own (such as the IP addresses), the TCP dissector will overwrite the IP information, and so on.
There are a lot of different columns available. Which columns are displayed can be selected by preference settings, .
The default columns will show:
- No. The number of the packet in the capture file. This number won’t change, even if a display filter is used.
- Time The timestamp of the packet. The presentation format of this timestamp can be changed, .
- Source The address where this packet is coming from.
- Destination The address where this packet is going to.
- Protocol The protocol name in a short (perhaps abbreviated) version.
- Length The length of each packet.
- Info Additional information about the packet content.
The first column shows how each packet is related to the selected packet. For example, in the image above the first packet is selected, which is a DNS request. Wireshark shows a rightward arrow for the request itself, followed by a leftward arrow for the response in packet 2. Why is there a dashed line? There are more DNS packets further down that use the same port numbers. Wireshark treats them as belonging to the same conversation and draws a line connecting them.
Table 3.15. Related packet symbols

First packet in a conversation.

Part of the selected conversation.

Not part of the selected conversation.

Last packet in a conversation.

Request.

Response.

The selected packet acknowledges this packet.

The selected packet is a duplicate acknowledgement of this packet.

The selected packet is related to this packet in some other way, e.g. as part of reassembly.
The packet list has an Intelligent Scrollbar which shows a miniature map of nearby packets. Each raster line of the scrollbar corresponds to a single packet, so the number of packets shown in the map depends on your physical display and the height of the packet list. A tall packet list on a high-resolution (“Retina”) display will show you quite a few packets. In the image above the scrollbar shows the status of more than 500 packets along with the 15 shown in the packet list itself.
Right clicking will show a context menu, described in Figure 6.4, “Pop-up menu of the “Packet List” pane”.
### The “Packet Details” pane
The packet details pane shows the current packet (selected in the “Packet List” pane) in a more detailed form.
Figure 3.17. The “Packet Details” pane
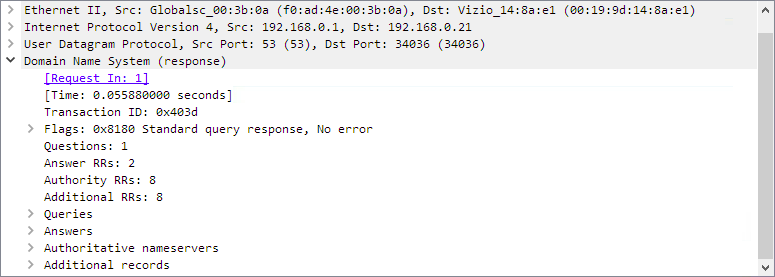
This pane shows the protocols and protocol fields of the packet selected in the “Packet List” pane. The protocols and fields of the packet shown in a tree which can be expanded and collapsed.
There is a context menu (right mouse click) available.
Some protocol fields have special meanings.
- Generated fields. Wireshark itself will generate additional protocol information which isn’t present in the captured data. This information is enclosed in square brackets (‘[’ and ‘]’). Generated information includes response times, TCP analysis, GeoIP information, and checksum validation.
- Links. If Wireshark detects a relationship to another packet in the capture file it will generate a link to that packet. Links are underlined and displayed in blue. If you double-clicked on a link Wireshark will jump to the corresponding packet.
### The “Packet Bytes” pane
The packet bytes pane shows the data of the current packet (selected in the “Packet List” pane) in a hexdump style.
Figure 3.18. The “Packet Bytes” pane
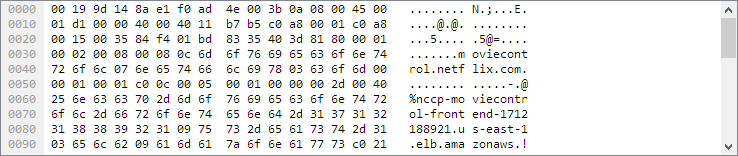
The “Packet Bytes” pane shows a canonical hex dump of the packet data. Each line contains the data offset, sixteen hexadecimal bytes, and sixteen ASCII bytes. Non-printalbe bytes are replaced with a period (‘.’).
Depending on the packet data, sometimes more than one page is available, e.g. when Wireshark has reassembled some packets into a single chunk of data. ( for details). In this case you can see each data source by clicking its corresponding tab at the bottom of the pane.
Figure 3.19. The “Packet Bytes” pane with tabs
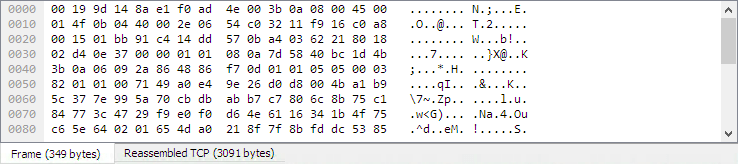
Additional pages typically contain data reassembled from multiple packets or decrypted data.
The context menu (right mouse click) of the tab labels will show a list of all available pages. This can be helpful if the size in the pane is too small for all the tab labels.
## 6. The Statusbar
The statusbar displays informational messages.
In general, the left side will show context related information, the middle part will show information about the current capture file, and the right side will show the selected configuration profile. Drag the handles between the text areas to change the size.
Figure 3.20. The initial Statusbar
This statusbar is shown while no capture file is loaded, e.g. when Wireshark is started.
Figure 3.21. The Statusbar with a loaded capture file

- The colorized bullet on the left shows the highest expert info level found in the currently loaded capture file. Hovering the mouse over this icon will show a textual description of the expert info level, and clicking the icon will bring up the Expert Infos dialog box. For a detailed description of expert info, .
- The left side shows information about the capture file, its name, its size and the elapsed time while it was being captured. Hovering over a file name will show its full path and size.
The middle part shows the current number of packets in the capture file. The following values are displayed:
- Packets: The number of captured packets.
- Displayed: The number of packets currently being displayed.
- Marked: The number of marked packets (only displayed if packets are marked).
- Dropped: The number of dropped packets (only displayed if Wireshark was unable to capture all packets).
- Ignored: The number of ignored packets (only displayed if packets are ignored).
- Load time: The time it took to load the capture (wall clock time).
- The right side shows the selected configuration profile. Clicking in this part of the statusbar will bring up a menu with all available configuration profiles, and selecting from this list will change the configuration profile.
Figure 3.22. The Statusbar with a configuration profile menu
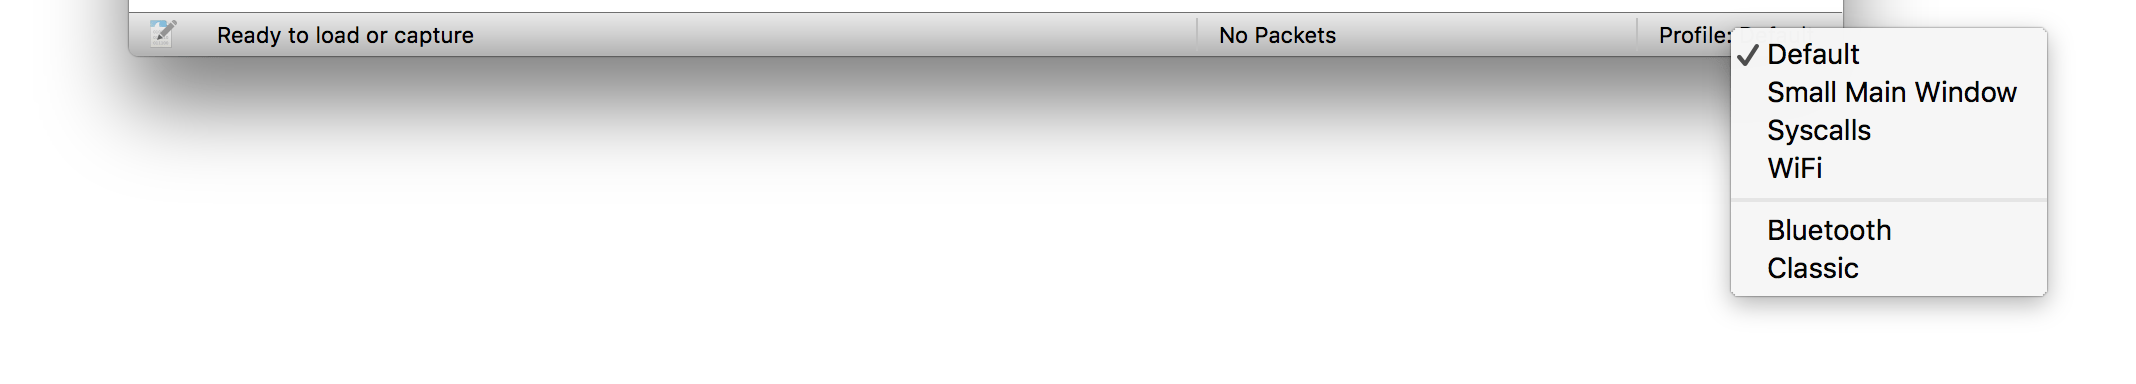
For a detailed description of configuration profiles, .
Figure 3.23. The Statusbar with a selected protocol field

This is displayed if you have selected a protocol field from the “Packet Details” pane.
The value between the parentheses (in this example ‘ipv6.src’) can be used as a display filter, representing the selected protocol field.
Figure 3.24. The Statusbar with a display filter message

This is displayed if you are trying to use a display filter which may have unexpected results. For a detailed description, .
Sources
- https://www.wireshark.org/docs/wsug_html/#ChapterUsing