Travailler avec des captures Wireshark
Texte en anglais
1. Viewing packets you have captured
Once you have captured some packets or you have opened a previously saved capture file, you can view the packets that are displayed in the packet list pane by simply clicking on a packet in the packet list pane, which will bring up the selected packet in the tree view and byte view panes.
You can then expand any part of the tree to view detailed information about each protocol in each packet. Clicking on an item in the tree will highlight the corresponding bytes in the byte view. An example with a TCP packet selected is shown in Figure 6.1, “Wireshark with a TCP packet selected for viewing”. It also has the Acknowledgment number in the TCP header selected, which shows up in the byte view as the selected bytes.
Figure 6.1. Wireshark with a TCP packet selected for viewing
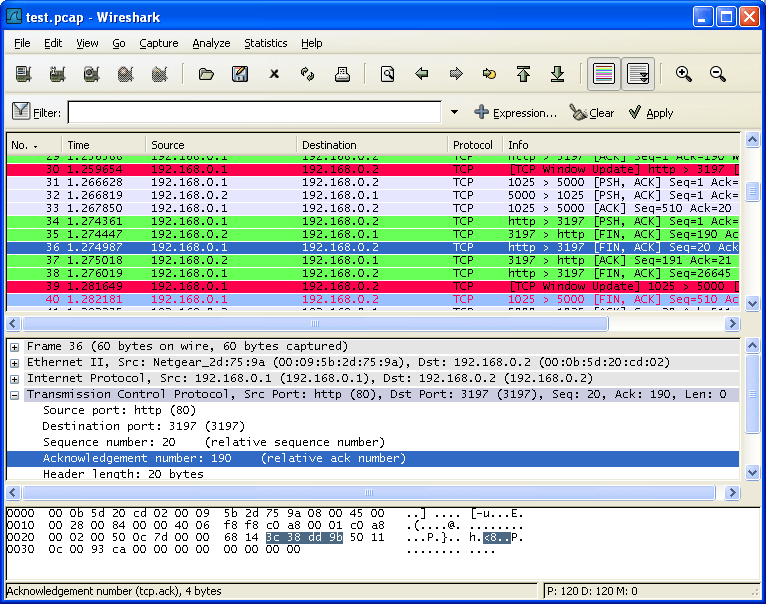
You can also select and view packets the same way while Wireshark is capturing if you selected “Update list of packets in real time” in the “Capture Preferences” dialog box.
In addition you can view individual packets in a separate window as shown in Figure 6.2, “Viewing a packet in a separate window”. You can do this by double-clicking on an item in the packet list or by selecting the packet in which you are interested in the packet list pane and selecting View → Show Packet in New Window. This allows you to easily compare two or more packets, even across multiple files.
Figure 6.2. Viewing a packet in a separate window
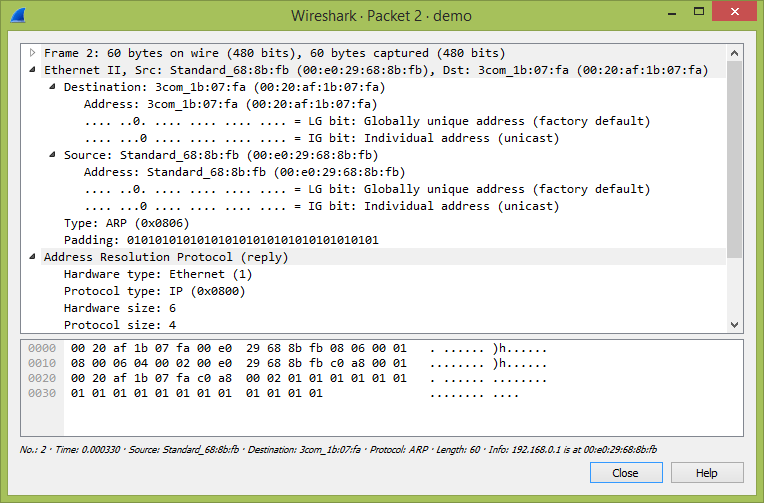
Along with double-clicking the packet list and using the main menu there are a number of other ways to open a new packet window:
- Hold down the shift key and double-click on a frame link in the packet details.
- From Table 6.2, “The menu items of the “Packet List” pop-up menu”.
- From Table 6.3, “The menu items of the “Packet Details” pop-up menu”.
2. Pop-up menus
You can bring up a pop-up menu over either the “Packet List”, its column header, or “Packet Details” pane by clicking your right mouse button at the corresponding pane.
2.1. Pop-up menu of the “Packet List” column header
Figure 6.3. Pop-up menu of the “Packet List” column header
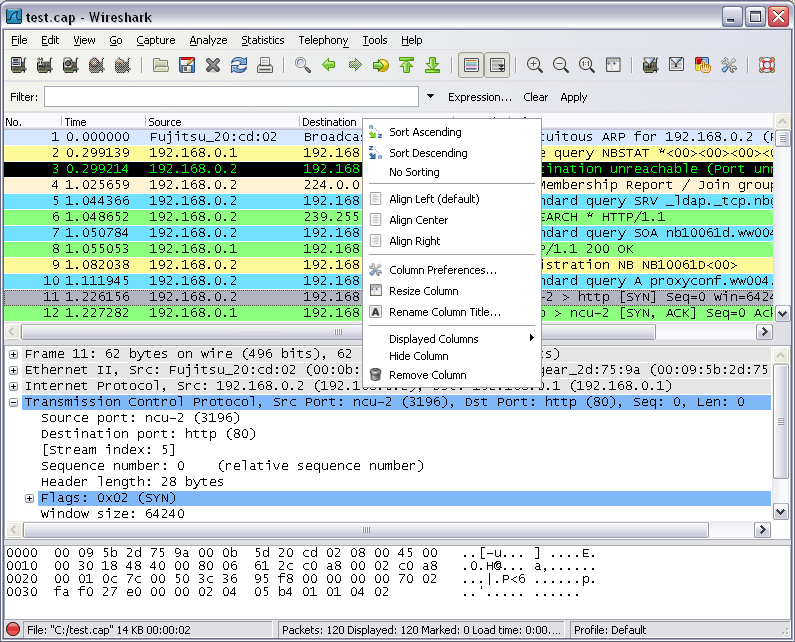
The following table gives an overview of which functions are available in this header, where to find the corresponding function in the main menu, and a short description of each item.
Table 6.1. The menu items of the “Packet List” column header pop-up menu
| Item | Identical to main menu’s item: | Description |
|---|---|---|
| Sort Ascending | Sort the packet list in ascending order based on this column. | |
| Sort Descending | Sort the packet list in descending order based on this column. | |
| No Sort | Remove sorting order based on this column. | |
| Align Left | Set left alignment of the values in this column. | |
| Align Center | Set center alignment of the values in this column. | |
| Align Right | Set right alignment of the values in this column. | |
| Column Preferences… | Open the Preferences dialog box on the column tab. | |
| Resize Column | Resize the column to fit the values. | |
| Rename Column Title | Allows you to change the title of the column header. | |
| Displayed Column | View | This menu items folds out with a list of all configured columns. These columns can now be shown or hidden in the packet list. |
| Hide Column | Allows you to hide the column from the packet list. | |
| Remove Column | Allows you to remove the column from the packet list. |
2.2. Pop-up menu of the “Packet List” pane
Figure 6.4. Pop-up menu of the “Packet List” pane
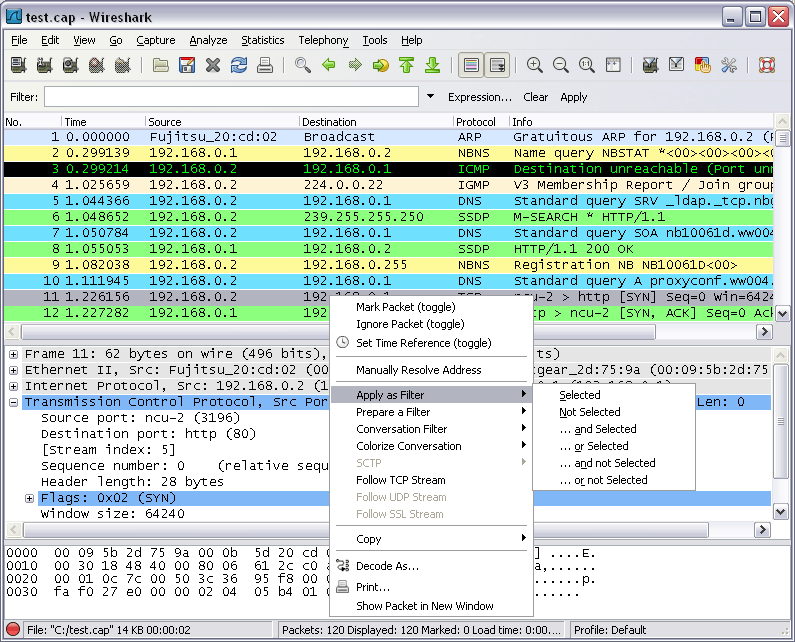
The following table gives an overview of which functions are available in this pane, where to find the corresponding function in the main menu, and a short description of each item.
Table 6.2. The menu items of the “Packet List” pop-up menu
| Item | Identical to main menu’s item: | Description |
|---|---|---|
| Mark Packet (toggle) | Edit | Mark/unmark a packet. |
| Ignore Packet (toggle) | Edit | Ignore or inspect this packet while dissecting the capture file. |
| Set Time Reference (toggle) | Edit | Set/reset a time reference. |
| Manually Resolve Address | Allows you to enter a name to resolve for the selected address. | |
| Apply as Filter | Analyze | Prepare and apply a display filter based on the currently selected item. |
| Prepare a Filter | Analyze | Prepare a display filter based on the currently selected item. |
| Conversation Filter | This menu item applies a display filter with the address information from the selected packet. E.g. the IP menu entry will set a filter to show the traffic between the two IP addresses of the current packet. XXX - add a new section describing this better. | |
| Colorize Conversation | This menu item uses a display filter with the address information from the selected packet to build a new colorizing rule. | |
| SCTP | Allows you to analyze and prepare a filter for this SCTP association. | |
| Follow TCP Stream | Analyze | Allows you to view all the data on a TCP stream between a pair of nodes. |
| Follow UDP Stream | Analyze | Allows you to view all the data on a UDP datagram stream between a pair of nodes. |
| Follow SSL Stream | Analyze | Same as “Follow TCP Stream” but for SSL. XXX - add a new section describing this better. |
| Copy/ Summary (Text) | Copy the summary fields as displayed to the clipboard, as tab-separated text. | |
| Copy/ Summary (CSV) | Copy the summary fields as displayed to the clipboard, as comma-separated text. | |
| Copy/ As Filter | Prepare a display filter based on the currently selected item and copy that filter to the clipboard. | |
| Copy/ Bytes (Offset Hex Text) | Copy the packet bytes to the clipboard in hexdump-like format. | |
| Copy/ Bytes (Offset Hex) | Copy the packet bytes to the clipboard in hexdump-like format, but without the text portion. | |
| Copy/ Bytes (Printable Text Only) | Copy the packet bytes to the clipboard as ASCII text, excluding non-printable characters. | |
| Copy/ Bytes (Hex Stream) | Copy the packet bytes to the clipboard as an unpunctuated list of hex digits. | |
| Copy/ Bytes (Binary Stream) | Copy the packet bytes to the clipboard as raw binary. The data is stored in the clipboard as MIME-type “application/octet-stream”. | |
| Decode As… | Analyze | Change or apply a new relation between two dissectors. |
| Print… | File | Print packets. |
| Show Packet in New Window | View | Display the selected packet in a new window. |
2.3. Pop-up menu of the “Packet Details” pane
Figure 6.5. Pop-up menu of the “Packet Details” pane
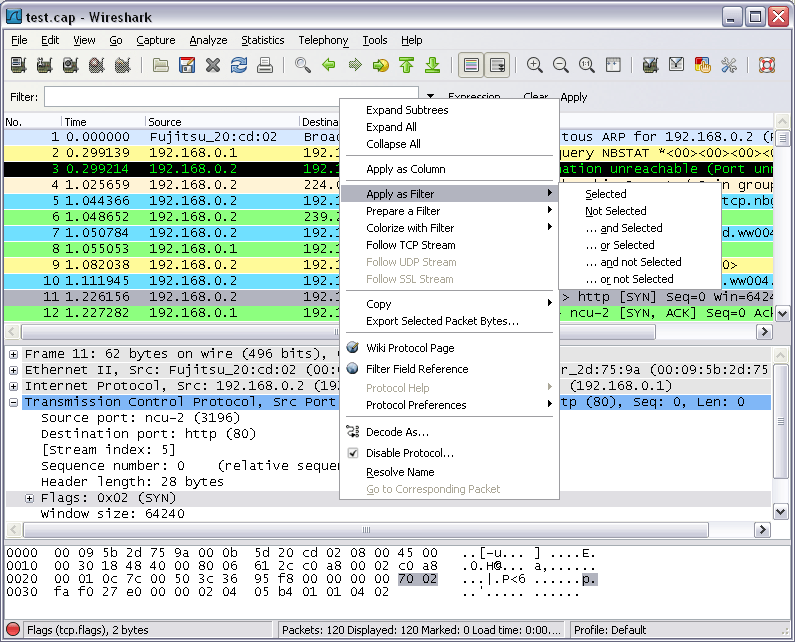
The following table gives an overview of which functions are available in this pane, where to find the corresponding function in the main menu, and a short description of each item.
Table 6.3. The menu items of the “Packet Details” pop-up menu
| Item | Identical to main menu’s item: | Description |
|---|---|---|
| Expand Subtrees | View | Expand the currently selected subtree. |
| Collapse Subtrees | View | Collapse the currently selected subtree. |
| Expand All | View | Expand all subtrees in all packets in the capture. |
| Collapse All | View | Wireshark keeps a list of all the protocol subtrees that are expanded, and uses it to ensure that the correct subtrees are expanded when you display a packet. This menu item collapses the tree view of all packets in the capture list. |
| Apply as Column | Use the selected protocol item to create a new column in the packet list. | |
| Apply as Filter | Analyze | Prepare and apply a display filter based on the currently selected item. |
| Prepare a Filter | Analyze | Prepare a display filter based on the currently selected item. |
| Colorize with Filter | This menu item uses a display filter with the information from the selected protocol item to build a new colorizing rule. | |
| Follow TCP Stream | Analyze | Allows you to view all the data on a TCP stream between a pair of nodes. |
| Follow UDP Stream | Analyze | Allows you to view all the data on a UDP datagram stream between a pair of nodes. |
| Follow SSL Stream | Analyze | Same as “Follow TCP Stream” but for SSL. XXX - add a new section describing this better. |
| Copy/ Description | Edit | Copy the displayed text of the selected field to the system clipboard. |
| Copy/ Fieldname | Edit | Copy the name of the selected field to the system clipboard. |
| Copy/ Value | Edit | Copy the value of the selected field to the system clipboard. |
| Copy/ As Filter | Edit | Prepare a display filter based on the currently selected item and copy it to the clipboard. |
| Copy/ Bytes (Offset Hex Text) | Copy the packet bytes to the clipboard in hexdump-like format; similar to the Packet List Pane command, but copies only the bytes relevant to the selected part of the tree (the bytes selected in the Packet Bytes Pane). | |
| Copy/ Bytes (Offset Hex) | Copy the packet bytes to the clipboard in hexdump-like format, but without the text portion; similar to the Packet List Pane command, but copies only the bytes relevant to the selected part of the tree (the bytes selected in the Packet Bytes Pane). | |
| Copy/ Bytes (Printable Text Only) | Copy the packet bytes to the clipboard as ASCII text, excluding non-printable characters; similar to the Packet List Pane command, but copies only the bytes relevant to the selected part of the tree (the bytes selected in the Packet Bytes Pane). | |
| Copy/ Bytes (Hex Stream) | Copy the packet bytes to the clipboard as an unpunctuated list of hex digits; similar to the Packet List Pane command, but copies only the bytes relevant to the selected part of the tree (the bytes selected in the Packet Bytes Pane). | |
| Copy/ Bytes (Binary Stream) | Copy the packet bytes to the clipboard as raw binary; similar to the Packet List Pane command, but copies only the bytes relevant to the selected part of the tree (the bytes selected in the Packet Bytes Pane). The data is stored in the clipboard as MIME-type “application/octet-stream”. | |
| Export Selected Packet Bytes… | File | This menu item is the same as the File menu item of the same name. It allows you to export raw packet bytes to a binary file. |
| Wiki Protocol Page | Show the wiki page corresponding to the currently selected protocol in your web browser. | |
| Filter Field Reference | Show the filter field reference web page corresponding to the currently selected protocol in your web browser. | |
| Protocol Preferences… | The menu item takes you to the properties dialog and selects the page corresponding to the protocol if there are properties associated with the highlighted field. More information on preferences can be found in Figure 10.7, “The preferences dialog box”. | |
| Decode As… | Analyze | Change or apply a new relation between two dissectors. |
| Disable Protocol | Allows you to temporarily disable a protocol dissector, which may be blocking the legitimate dissector. | |
| Resolve Name | View | Causes a name resolution to be performed for the selected packet, but NOT every packet in the capture. |
| Go to Corresponding Packet | Go | If the selected field has a corresponding packet, go to it. Corresponding packets will usually be a request/response packet pair or such. |
3. Filtering packets while viewing
Wireshark has two filtering languages: One used when capturing packets, and one used when displaying packets. In this section we explore that second type of filter: Display filters. The first one has already been dealt with in Section 4.13, “Filtering while capturing”.
Display filters allow you to concentrate on the packets you are interested in while hiding the currently uninteresting ones. They allow you to select packets by:
- Protocol
- The presence of a field
- The values of fields
- A comparison between fields
- … and a lot more!
To select packets based on protocol type, simply type the protocol in which you are interested in the Filter: field in the filter toolbar of the Wireshark window and press enter to initiate the filter. Figure 6.6, “Filtering on the TCP protocol” shows an example of what happens when you type tcp in the filter field.
All protocol and field names are entered in lowercase. Also, don’t forget to press enter after entering the filter expression.
Figure 6.6. Filtering on the TCP protocol
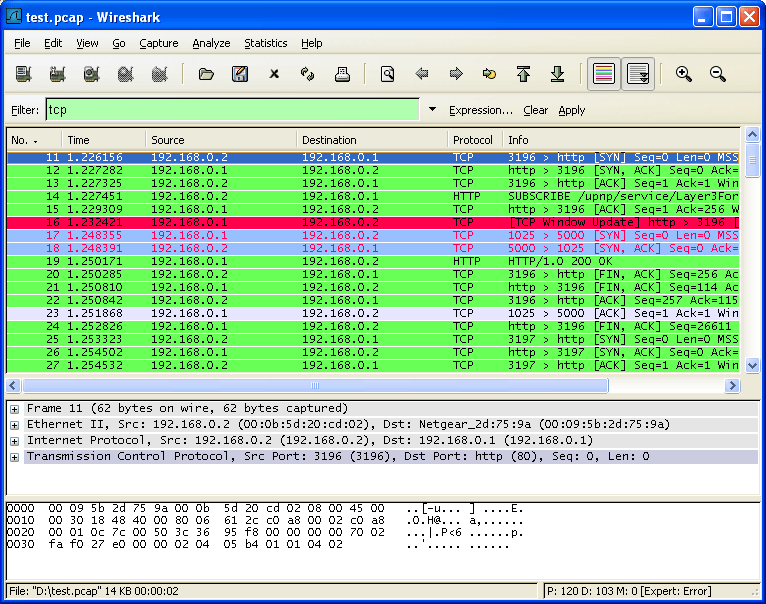
As you might have noticed, only packets of the TCP protocol are displayed now (e.g. packets 1-10 are hidden). The packet numbering will remain as before, so the first packet shown is now packet number 11.
When using a display filter, all packets remain in the capture file. The display filter only changes the display of the capture file but not its content!
You can filter on any protocol that Wireshark understands. You can also filter on any field that a dissector adds to the tree view, but only if the dissector has added an abbreviation for the field. A list of such fields is available in Wireshark in the Add Expression… dialog box. You can find more information on the Add Expression… dialog box in Section 6.5, “The “Filter Expression” dialog box”.
For example, to narrow the packet list pane down to only those packets to or from the IP address 192.168.0.1, use ip.addr==192.168.0.1.
To remove the filter, click on the Clear button to the right of the filter field.
4. Building display filter expressions
Wireshark provides a simple but powerful display filter language that allows you to build quite complex filter expressions. You can compare values in packets as well as combine expressions into more specific expressions. The following sections provide more information on doing this.
You will find a lot of Display Filter examples at the Wireshark Wiki Display Filter page at: https://wiki.wireshark.org/DisplayFilters.
4.1. Display filter fields
Every field in the packet details pane can be used as a filter string, this will result in showing only the packets where this field exists. For example: the filter string: tcp will show all packets containing the tcp protocol.
There is a complete list of all filter fields available through the menu item Help → Supported Protocols in the page “Display Filter Fields” of the “Supported Protocols” dialog.
4.2. Comparing values
You can build display filters that compare values using a number of different comparison operators. They are shown in Table 6.4, “Display Filter comparison operators”.
You can use English and C-like terms in the same way, they can even be mixed in a filter string.
Table 6.4. Display Filter comparison operators
| English | C-like | Description and example |
|---|---|---|
| eq | == | Equal. ip.src==10.0.0.5 |
| ne | != | Not equal. ip.src!=10.0.0.5 |
| gt | > | Greater than. frame.len > 10 |
| lt | < | Less than. frame.len < 128 |
| ge | >= | Greater than or equal to. frame.len ge 0x100 |
| le | <= | Less than or equal to. frame.len <= 0x20 |
| contains | Protocol, field or slice contains a value. sip.To contains "a1762" | |
| matches | ~ | Protocol or text field match Perl regualar expression. http.host matches "acme\.(org|com|net)" |
| bitwise_and | & | Compare bit field value. tcp.flags & 0x02 |
In addition, all protocol fields have a type. Display Filter Field Types provides a list of the types and example of how to express them.
Display Filter Field Types
Unsigned integer Can be 8, 16, 24, 32, or 64 bits. You can express integers in decimal, octal, or hexadecimal. The following display filters are equivalent:
ip.len le 1500
ip.len le 02734
ip.len le 0x436
Signed integer Can be 8, 16, 24, 32, or 64 bits. As with unsigned integers you can use decimal, octal, or hexadecimal.
Boolean A boolean field is present in the protocol decode only if its value is true. For example, tcp.flags.syn is present, and thus true, only if the SYN flag is present in a TCP segment header.
The filter expression  +tcp.flags.syn+ will select only  those packets for which
this flag exists, that is,  TCP segments where the segment header contains the
SYN flag. Similarly, to find source-routed token ring packets, use a filter
expression of  +tr.sr+.
Ethernet address 6 bytes separated by a colon (:), dot (.) or dash (-) with one or two bytes between separators:
eth.dst == ff:ff:ff:ff:ff:ff
eth.dst == ff-ff-ff-ff-ff-ff
eth.dst == ffff.ffff.ffff
IPv4 address ip.addr == 192.168.0.1
Classless InterDomain Routing (CIDR) notation can be used to test if
an IPv4 address is in a certain subnet. For example, this display
filter will find all packets in the 129.111 Class-B network:
ip.addr == 129.111.0.0/16
IPv6 address ipv6.addr == ::1
As with IPv4 addresses, IPv6 addresses can match a subnet.
Text string http.request.uri == "https://www.wireshark.org/"
udp contains 81:60:03
The example above match packets that contains the 3-byte sequence 0x81, 0x60, 0x03 anywhere in the UDP header or payload.
sip.To contains "a1762"
Above example match packets where SIP To-header contains the string “a1762” anywhere in the header.
http.host matches "acme\.(org|com|net)"
The example above match HTTP packets where the HOST header contains acme.org or acme.com or acme.net. Note: Wireshark needs to be built with libpcre in order to be able to use the matches resp. ~ operator.
tcp.flags & 0x02
That expression will match all packets that contain a “tcp.flags” field with the 0x02 bit, i.e. the SYN bit, set.
4.3. Combining expressions
You can combine filter expressions in Wireshark using the logical operators shown in Table 6.5, “Display Filter Logical Operations”
Table 6.5. Display Filter Logical Operations
| English | C-like | Description and example | ||
|---|---|---|---|---|
| and | && | Logical AND. ip.src==10.0.0.5 and tcp.flags.fin | ||
| or | Logical OR. ip.scr==10.0.0.5 or ip.src==192.1.1.1 | |||
| xor | \^\^ | Logical XOR. tr.dst[0:3] == 0.6.29 xor tr.src[0:3] == 0.6.29 | ||
| not | ! | Logical NOT. not llc | ||
| […] | See “Substring Operator” below. | |||
| in | See “Membership Operator” below. |
6.4.4. Substring Operator
Wireshark allows you to select subsequences of a sequence in rather elaborate ways. After a label you can place a pair of brackets [] containing a comma separated list of range specifiers.
eth.src[0:3] == 00:00:83
The example above uses the n:m format to specify a single range. In this case n is the beginning offset and m is the length of the range being specified.
eth.src[1-2] == 00:83
The example above uses the n-m format to specify a single range. In this case n is the beginning offset and m is the ending offset.
eth.src[:4] == 00:00:83:00
The example above uses the :m format, which takes everything from the beginning of a sequence to offset m. It is equivalent to 0:m
eth.src[4:] == 20:20
The example above uses the n: format, which takes everything from offset n to the end of the sequence.
eth.src[2] == 83
The example above uses the n format to specify a single range. In this case the element in the sequence at offset n is selected. This is equivalent to n:1.
eth.src[0:3,1-2,:4,4:,2] ==
00:00:83:00:83:00:00:83:00:20:20:83
Wireshark allows you to string together single ranges in a comma separated list to form compound ranges as shown above.
4.5. Membership Operator.
Wireshark allows you to test a field for membership in a set of values or fields. After the field name, use the in operator followed by the set items surrounded by braces {}.
tcp.port in {80 443 8080}
This can be considered a shortcut operator, as the previous expression could have been expressed as:
tcp.port == 80 || tcp.port == 443 || tcp.port == 8080
4.6. A Common Mistake
Using the != operator on combined expressions like eth.addr, ip.addr, tcp.port, and udp.port will probably not work as expected.
Often people use a filter string to display something like ip.addr == 1.2.3.4 which will display all packets containing the IP address 1.2.3.4.
Then they use ip.addr != 1.2.3.4 to see all packets not containing the IP address 1.2.3.4 in it. Unfortunately, this does not do the expected.
Instead, that expression will even be true for packets where either source or destination IP address equals 1.2.3.4. The reason for this, is that the expression ip.addr != 1.2.3.4 must be read as “the packet contains a field named ip.addr with a value different from 1.2.3.4”. As an IP datagram contains both a source and a destination address, the expression will evaluate to true whenever at least one of the two addresses differs from 1.2.3.4.
If you want to filter out all packets containing IP datagrams to or from IP address 1.2.3.4, then the correct filter is !(ip.addr == 1.2.3.4) as it reads “show me all the packets for which it is not true that a field named ip.addr exists with a value of 1.2.3.4”, or in other words, “filter out all packets for which there are no occurrences of a field named ip.addr with the value 1.2.3.4”.
5. The “Filter Expression” dialog box
When you are accustomed to Wireshark’s filtering system and know what labels you wish to use in your filters it can be very quick to simply type a filter string. However if you are new to Wireshark or are working with a slightly unfamiliar protocol it can be very confusing to try to figure out what to type. The “Filter Expression” dialog box helps with this.
The “Filter Expression” dialog box is an excellent way to learn how to write Wireshark display filter strings.
Figure 6.7. The “Filter Expression” dialog box
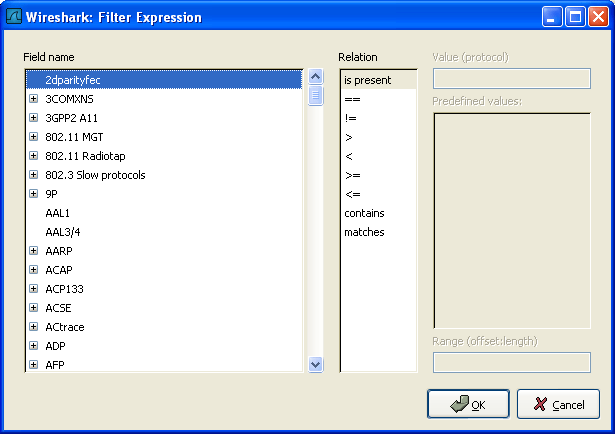
When you first bring up the Filter Expression dialog box you are shown a tree of field names, organized by protocol, and a box for selecting a relation.
Field Name Select a protocol field from the protocol field tree. Every protocol with filterable fields is listed at the top level. (You can search for a particular protocol entry by entering the first few letters of the protocol name). By expanding a protocol name you can get a list of the field names available for filtering for that protocol.
Relation Select a relation from the list of available relation. The is present is a unary relation which is true if the selected field is present in a packet. All other listed relations are binary relations which require additional data (e.g. a Value to match) to complete.
When you select a field from the field name list and select a binary relation (such as the equality relation ==) you will be given the opportunity to enter a value, and possibly some range information.
Value You may enter an appropriate value in the Value text box. The Value will also indicate the type of value for the field name you have selected (like character string).
Predefined values Some of the protocol fields have predefined values available, much like enum’s in C. If the selected protocol field has such values defined, you can choose one of them here.
Range A range of integers or a group of ranges, such as 1-12 or 39-42,98-2000.
OK When you have built a satisfactory expression click OK and a filter string will be built for you.
Cancel You can leave the “Add Expression…” dialog box without any effect by clicking the Cancel button.
6. Defining and saving filters
You can define filters with Wireshark and give them labels for later use. This can save time in remembering and retyping some of the more complex filters you use.
To define a new filter or edit an existing one, select Capture → Capture Filters… or Analyze → Display Filters…. Wireshark will then pop up the Filters dialog as shown in Figure 6.8, “The “Capture Filters” and “Display Filters” dialog boxes”.
The mechanisms for defining and saving capture filters and display filters are almost identical. Both will be described here but the differences between these two will be marked as such.
Warning
You must use Save to save your filters permanently. OK or Apply will not save the filters and they will be lost when you close Wireshark.
Figure 6.8. The “Capture Filters” and “Display Filters” dialog boxes
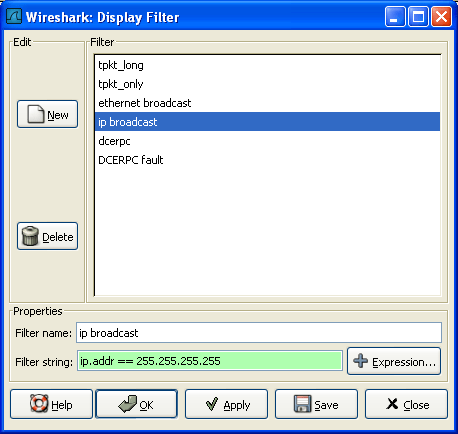
New This button adds a new filter to the list of filters. The currently entered values from Filter name and Filter string will be used. If any of these fields are empty, it will be set to “new”.
Delete This button deletes the selected filter. It will be greyed out, if no filter is selected.
Filter You can select a filter from this list (which will fill in the filter name and filter string in the fields down at the bottom of the dialog box).
Filter name: You can change the name of the currently selected filter here.
The filter name will only be used in this dialog to identify the filter for your convenience, it will not be used elsewhere. You can add multiple filters with the same name, but this is not very useful.
Filter string: You can change the filter string of the currently selected filter here. Display Filter only: the string will be syntax checked while you are typing.
Add Expression… Display Filter only: This button brings up the Add Expression dialog box which assists in building filter strings. You can find more information about the Add Expression dialog in Section 6.5, “The “Filter Expression” dialog box”
OK Display Filter only: This button applies the selected filter to the current display and closes the dialog.
Apply Display Filter only: This button applies the selected filter to the current display, and keeps the dialog open.
Save Save the current settings in this dialog. The file location and format is explained in Appendix B, Files and Folders.
Close Close this dialog. This will discard unsaved settings.
7. Defining and saving filter macros
You can define filter macros with Wireshark and give them labels for later use. This can save time in remembering and retyping some of the more complex filters you use.
8. Finding packets
You can easily find packets once you have captured some packets or have read in a previously saved capture file. Simply select the Find Packet… menu item from the Edit menu. Wireshark will pop up the dialog box shown in Figure 6.9, “The “Find Packet” dialog box”.
8.1. The “Find Packet” dialog box
Figure 6.9. The “Find Packet” dialog box
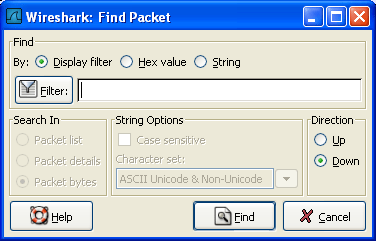
You might first select the kind of thing to search for:
Display filter
Simply enter a display filter string into the Filter: field, select a direction, and click on OK.
For example, to find the three way handshake for a connection from host 192.168.0.1, use the following filter string:
ip.src==192.168.0.1 and tcp.flags.syn==1
For more details on display filters, see Section 6.3, “Filtering packets while viewing”
Hex Value
Search for a specific byte sequence in the packet data.
For example, use “00:00” to find the next packet including two null bytes in the packet data.
String
Find a string in the packet data, with various options.
The value to be found will be syntax checked while you type it in. If the syntax check of your value succeeds, the background of the entry field will turn green, if it fails, it will turn red.
You can choose the search direction:
Up
Search upwards in the packet list (decreasing packet numbers).
Down
Search downwards in the packet list (increasing packet numbers).
8.2. The “Find Next” command
“Find Next” will continue searching with the same options used in the last “Find Packet”.
8.3. The “Find Previous” command
“Find Previous” will do the same thing as “Find Next”, but in the reverse direction.
9. Go to a specific packet
You can easily jump to specific packets with one of the menu items in the Go menu.
6.9.1. The “Go Back” command
Go back in the packet history, works much like the page history in current web browsers.
6.9.2. The “Go Forward” command
Go forward in the packet history, works much like the page history in current web browsers.
9.3. The “Go to Packet” dialog box
Figure 6.10. The “Go To Packet” dialog box
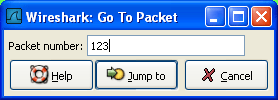
This dialog box will let you enter a packet number. When you press OK, Wireshark will jump to that packet.
9.4. The “Go to Corresponding Packet” command
If a protocol field is selected which points to another packet in the capture file, this command will jump to that packet.
As these protocol fields now work like links (just as in your Web browser), it’s easier to simply double-click on the field to jump to the corresponding field.
9.5. The “Go to First Packet” command
This command will simply jump to the first packet displayed.
9.6. The “Go to Last Packet” command
This command will simply jump to the last packet displayed.
10. Marking packets
You can mark packets in the “Packet List” pane. A marked packet will be shown with black background, regardless of the coloring rules set. Marking a packet can be useful to find it later while analyzing in a large capture file.
The packet marks are not stored in the capture file or anywhere else. All packet marks will be lost when you close the capture file.
You can use packet marking to control the output of packets when saving, exporting, or printing. To do so, an option in the packet range is available, see Section 5.9, “The “Packet Range” frame”.
There are three functions to manipulate the marked state of a packet:
- Mark packet (toggle) toggles the marked state of a single packet.
- Mark all displayed packets set the mark state of all displayed packets.
- Unmark all packets reset the mark state of all packets.
These mark functions are available from the “Edit” menu, and the “Mark packet (toggle)” function is also available from the pop-up menu of the “Packet List” pane.
11. Ignoring packets
You can ignore packets in the “Packet List” pane. Wireshark will then pretend that this packets does not exist in the capture file. An ignored packet will be shown with white background and gray foreground, regardless of the coloring rules set.
The packet ignored marks are not stored in the capture file or anywhere else. All “packet ignored” marks will be lost when you close the capture file.
There are three functions to manipulate the ignored state of a packet:
- Ignore packet (toggle) toggles the ignored state of a single packet.
- Ignore all displayed packets set the ignored state of all displayed packets.
- Un-Ignore all packets reset the ignored state of all packets.
These ignore functions are available from the “Edit” menu, and the “Ignore packet (toggle)” function is also available from the pop-up menu of the “Packet List” pane.
12. Time display formats and time references
While packets are captured, each packet is timestamped. These timestamps will be saved to the capture file, so they will be available for later analysis.
A detailed description of timestamps, timezones and alike can be found at: Section 7.5, “Time Stamps”.
The timestamp presentation format and the precision in the packet list can be chosen using the View menu, see Figure 3.5, “The “View” Menu”.
The available presentation formats are:
- Date and Time of Day: 1970-01-01 01:02:03.123456 The absolute date and time of the day when the packet was captured.
- Time of Day: 01:02:03.123456 The absolute time of the day when the packet was captured.
- Seconds Since Beginning of Capture: 123.123456 The time relative to the start of the capture file or the first “Time Reference” before this packet (see Section 6.12.1, “Packet time referencing”).
- Seconds Since Previous Captured Packet: 1.123456 The time relative to the previous captured packet.
- Seconds Since Previous Displayed Packet: 1.123456 The time relative to the previous displayed packet.
- Seconds Since Epoch (1970-01-01): 1234567890.123456 The time relative to epoch (midnight UTC of January 1, 1970).
The available precisions (aka. the number of displayed decimal places) are:
- Automatic The timestamp precision of the loaded capture file format will be used (the default).
- Seconds, Deciseconds, Centiseconds, Milliseconds, Microseconds or Nanoseconds The timestamp precision will be forced to the given setting. If the actually available precision is smaller, zeros will be appended. If the precision is larger, the remaining decimal places will be cut off.
Precision example: If you have a timestamp and it’s displayed using, “Seconds Since Previous Packet”, : the value might be 1.123456. This will be displayed using the “Automatic” setting for libpcap files (which is microseconds). If you use Seconds it would show simply 1 and if you use Nanoseconds it shows 1.123456000.
12.1. Packet time referencing
The user can set time references to packets. A time reference is the starting point for all subsequent packet time calculations. It will be useful, if you want to see the time values relative to a special packet, e.g. the start of a new request. It’s possible to set multiple time references in the capture file.
The time references will not be saved permanently and will be lost when you close the capture file.
Time referencing will only be useful if the time display format is set to “Seconds Since Beginning of Capture”. If one of the other time display formats are used, time referencing will have no effect (and will make no sense either).
To work with time references, choose one of the Time Reference items in the Edit menu or from the pop-up menu of the “Packet List” pane. See Section 3.6, “The “Edit” menu”.
- Set Time Reference (toggle) Toggles the time reference state of the currently selected packet to on or off.
- Find Next Find the next time referenced packet in the “Packet List” pane.
- Find Previous Find the previous time referenced packet in the “Packet List” pane.
Figure 6.11. Wireshark showing a time referenced packet
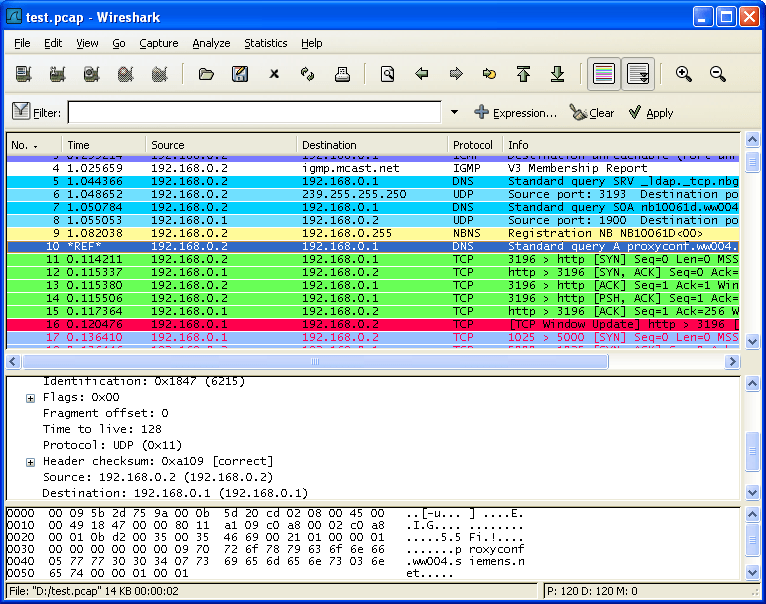
A time referenced packet will be marked with the string *REF* in the Time column (see packet number 10). All subsequent packets will show the time since the last time reference.
Sources
- https://www.wireshark.org/docs/wsug_html/#ChapterWork
